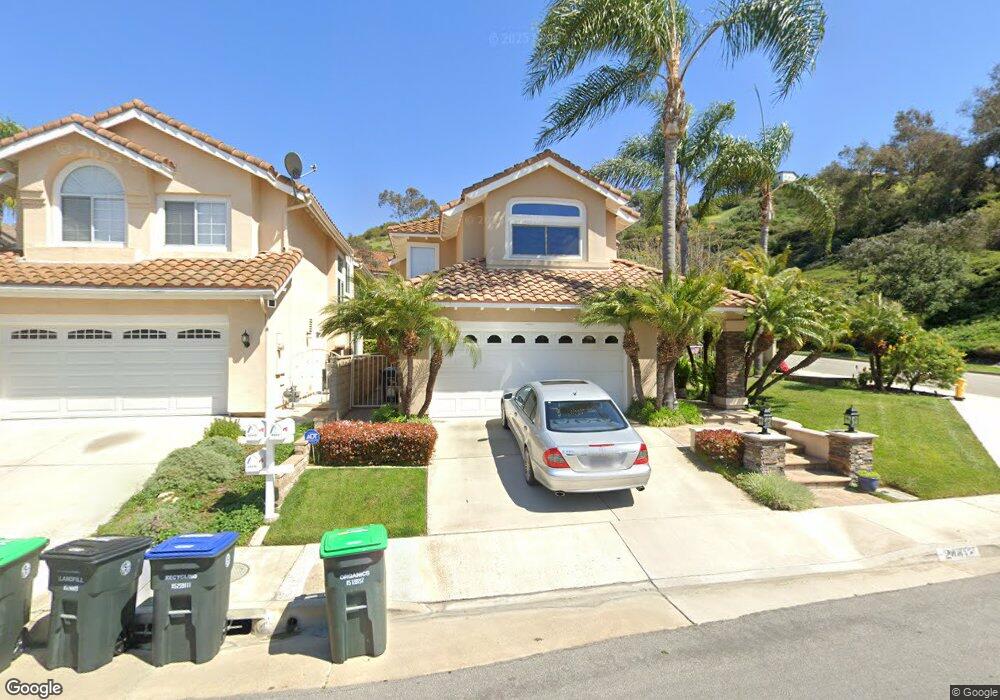
24412 Rue de Monet Laguna Niguel, CA 92677
Estimated Value: $1,521,000 - $1,824,000
4
Beds
3
Baths
2,488
Sq Ft
$670/Sq Ft
Est. Value
About This Home
This home is located at 24412 Rue de Monet, Laguna Niguel, CA 92677 and is currently estimated at $1,668,106, approximately $670 per square foot. 24412 Rue de Monet is a home located in Orange County with nearby schools including Hidden Hills Elementary, Niguel Hills Middle School, and Dana Hills High School.
Ownership History
Date
Name
Owned For
Owner Type
Purchase Details
Closed on
Jul 31, 2003
Sold by
Tan Loke K and Tan Cheng Cheng S
Bought by
Sommers Thomas A and Sommers Nancy G
Current Estimated Value
Home Financials for this Owner
Home Financials are based on the most recent Mortgage that was taken out on this home.
Original Mortgage
$322,700
Outstanding Balance
$140,447
Interest Rate
5.46%
Mortgage Type
Purchase Money Mortgage
Estimated Equity
$1,527,659
Purchase Details
Closed on
Mar 22, 1999
Sold by
Tan Loke K and Tan Cheng Cheng Saw
Bought by
Tan Loke K and Tan Cheng Cheng S
Purchase Details
Closed on
Mar 5, 1998
Sold by
Smith Edgar C and Smith Anita A
Bought by
Tan Loke Kun K and Tan Cheng Cheng Saw
Home Financials for this Owner
Home Financials are based on the most recent Mortgage that was taken out on this home.
Original Mortgage
$287,200
Interest Rate
7.07%
Create a Home Valuation Report for This Property
The Home Valuation Report is an in-depth analysis detailing your home's value as well as a comparison with similar homes in the area
Home Values in the Area
Average Home Value in this Area
Purchase History
| Date | Buyer | Sale Price | Title Company |
|---|---|---|---|
| Sommers Thomas A | $643,000 | Chicago Title Co | |
| Tan Loke K | -- | -- | |
| Tan Loke Kun K | $359,000 | Orange Coast Title |
Source: Public Records
Mortgage History
| Date | Status | Borrower | Loan Amount |
|---|---|---|---|
| Open | Sommers Thomas A | $322,700 | |
| Previous Owner | Tan Loke Kun K | $287,200 | |
| Closed | Tan Loke Kun K | $53,850 |
Source: Public Records
Tax History Compared to Growth
Tax History
| Year | Tax Paid | Tax Assessment Tax Assessment Total Assessment is a certain percentage of the fair market value that is determined by local assessors to be the total taxable value of land and additions on the property. | Land | Improvement |
|---|---|---|---|---|
| 2025 | $7,369 | $914,207 | $594,972 | $319,235 |
| 2024 | $7,369 | $896,282 | $583,306 | $312,976 |
| 2023 | $8,823 | $878,708 | $571,868 | $306,840 |
| 2022 | $8,654 | $861,479 | $560,655 | $300,824 |
| 2021 | $8,486 | $844,588 | $549,662 | $294,926 |
| 2020 | $8,401 | $835,928 | $544,026 | $291,902 |
| 2019 | $8,234 | $819,538 | $533,359 | $286,179 |
| 2018 | $8,075 | $803,469 | $522,901 | $280,568 |
| 2017 | $7,916 | $787,715 | $512,648 | $275,067 |
| 2016 | $7,763 | $772,270 | $502,596 | $269,674 |
| 2015 | $7,645 | $760,670 | $495,046 | $265,624 |
| 2014 | $7,497 | $745,770 | $485,349 | $260,421 |
Source: Public Records
Map
Nearby Homes
- 24625 Los Serranos Dr
- 24255 Rue de Gauguin
- 24561 Los Serranos Dr
- 24532 Kings View
- 1 O'Hill
- 24471 Los Serranos Dr
- 30042 Oceanus
- 24822 Cutter
- 24518 Sunshine Dr
- 24565 Camden Ct
- 24551 Camden Ct
- 23971 Stillwater Ln
- 24615 Kings Rd
- 24135 Las Naranjas Dr
- 24692 Sutton Ln
- 2 Novilla
- 14 Novilla
- 2 Corsica
- 25111 Adelanto Dr
- 29141 Bobolink Dr
- 24422 Rue de Monet
- 24426 Rue de Monet
- 24461 Rue de Gauguin
- 24432 Rue de Monet
- 24411 Rue de Monet
- 24471 Rue de Gauguin
- 24421 Rue de Monet
- 24442 Rue de Monet
- 24425 Rue de Monet
- 24431 Rue de Monet
- 24481 Rue de Gauguin
- 24452 Rue de Monet
- 24435 Rue de Monet
- 24395 Rue de Gauguin
- 24441 Rue de Monet
- 24491 Rue de Gauguin
- 24445 Rue de Monet
- 24456 Rue de Monet
- 24495 Rue de Gauguin
- 24451 Rue de Monet