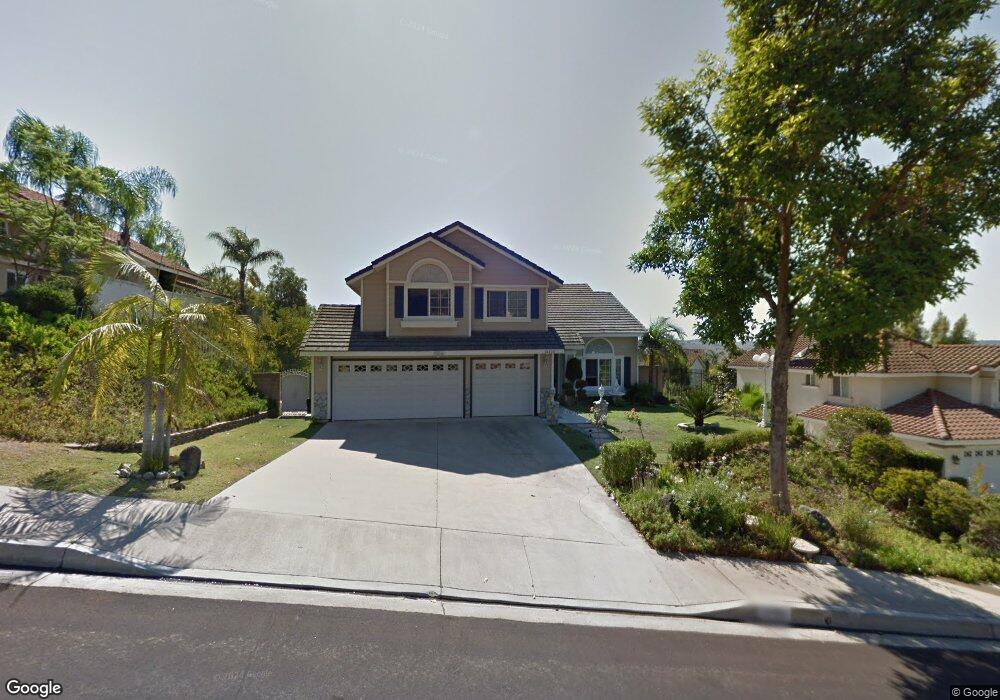
24428 Eastgate Dr Diamond Bar, CA 91765
Estimated Value: $1,176,154 - $1,449,000
5
Beds
3
Baths
2,355
Sq Ft
$543/Sq Ft
Est. Value
About This Home
This home is located at 24428 Eastgate Dr, Diamond Bar, CA 91765 and is currently estimated at $1,278,039, approximately $542 per square foot. 24428 Eastgate Dr is a home located in Los Angeles County with nearby schools including Pantera Elementary School, Lorbeer Middle School, and Diamond Ranch High School.
Ownership History
Date
Name
Owned For
Owner Type
Purchase Details
Closed on
Jun 7, 2022
Sold by
Dang and Cecillia
Bought by
Dang Kevin and Dang Cecillia
Current Estimated Value
Purchase Details
Closed on
Sep 23, 1998
Sold by
Lin Yun W
Bought by
Dang Kevin and Dang Cecillia
Home Financials for this Owner
Home Financials are based on the most recent Mortgage that was taken out on this home.
Original Mortgage
$200,000
Interest Rate
6.61%
Purchase Details
Closed on
Mar 3, 1997
Sold by
Diamond Bar East Partners
Bought by
Baik David L and Baik Frank L
Home Financials for this Owner
Home Financials are based on the most recent Mortgage that was taken out on this home.
Original Mortgage
$830,000
Interest Rate
7.86%
Purchase Details
Closed on
Jan 10, 1997
Sold by
Baik Sun Hee
Bought by
Baik Frank L
Home Financials for this Owner
Home Financials are based on the most recent Mortgage that was taken out on this home.
Original Mortgage
$830,000
Interest Rate
7.86%
Create a Home Valuation Report for This Property
The Home Valuation Report is an in-depth analysis detailing your home's value as well as a comparison with similar homes in the area
Home Values in the Area
Average Home Value in this Area
Purchase History
| Date | Buyer | Sale Price | Title Company |
|---|---|---|---|
| Dang Kevin | -- | None Listed On Document | |
| Dang Kevin | $270,000 | Equity Title | |
| Baik David L | -- | Stewart Title | |
| Baik Frank L | -- | Stewart Title | |
| Baik David L | -- | Stewart Title |
Source: Public Records
Mortgage History
| Date | Status | Borrower | Loan Amount |
|---|---|---|---|
| Previous Owner | Dang Kevin | $200,000 | |
| Previous Owner | Baik David L | $830,000 |
Source: Public Records
Tax History Compared to Growth
Tax History
| Year | Tax Paid | Tax Assessment Tax Assessment Total Assessment is a certain percentage of the fair market value that is determined by local assessors to be the total taxable value of land and additions on the property. | Land | Improvement |
|---|---|---|---|---|
| 2025 | $6,105 | $423,260 | $190,152 | $233,108 |
| 2024 | $6,105 | $414,962 | $186,424 | $228,538 |
| 2023 | $5,982 | $406,826 | $182,769 | $224,057 |
| 2022 | $5,870 | $398,850 | $179,186 | $219,664 |
| 2021 | $5,488 | $391,030 | $175,673 | $215,357 |
| 2019 | $5,591 | $379,433 | $170,463 | $208,970 |
| 2018 | $5,165 | $371,994 | $167,121 | $204,873 |
| 2016 | $4,851 | $357,551 | $160,633 | $196,918 |
| 2015 | $4,812 | $352,182 | $158,221 | $193,961 |
| 2014 | $4,675 | $345,284 | $155,122 | $190,162 |
Source: Public Records
Map
Nearby Homes
- 24449 Nan Ct
- 959 Whitecliff Dr
- 981 Silvertip Dr
- 1049 Longview Dr
- 715 Pantera Dr
- 1135 Summitridge Dr
- 1202 Longview Dr
- 24471 Rockbury Dr
- 547 Bellows Ct
- 683 Radbury Place
- 651 Radbury Place
- 529 Bregante Dr
- 24300 Knoll Ct
- 24030 Shotgun Ln
- 23509 Twin Spring Ln
- 454 Ballena Dr
- 1120 Cleghorn Dr Unit C
- 1116 Cleghorn Dr Unit B
- 23640 Monument Canyon Dr
- 1511 Deer Crossing Dr
- 24420 Eastgate Dr
- 24438 Eastgate Dr
- 901 Woodspring Place
- 900 Woodspring Place
- 24412 Eastgate Dr
- 903 Woodspring Place
- 905 Spencer Place
- 24425 Eastgate Dr
- 24433 Eastgate Dr
- 909 Spencer Place
- 24419 Eastgate Dr
- 24441 Eastgate Dr
- 904 Woodspring Place
- 907 Woodspring Place
- 944 Longview Dr
- 24406 Eastgate Dr
- 24411 Eastgate Dr
- 915 Spencer Place
- 24451 Eastgate Dr
- 948 Longview Dr