Estimated Value: $620,000 - $656,000
3
Beds
2
Baths
1,513
Sq Ft
$420/Sq Ft
Est. Value
About This Home
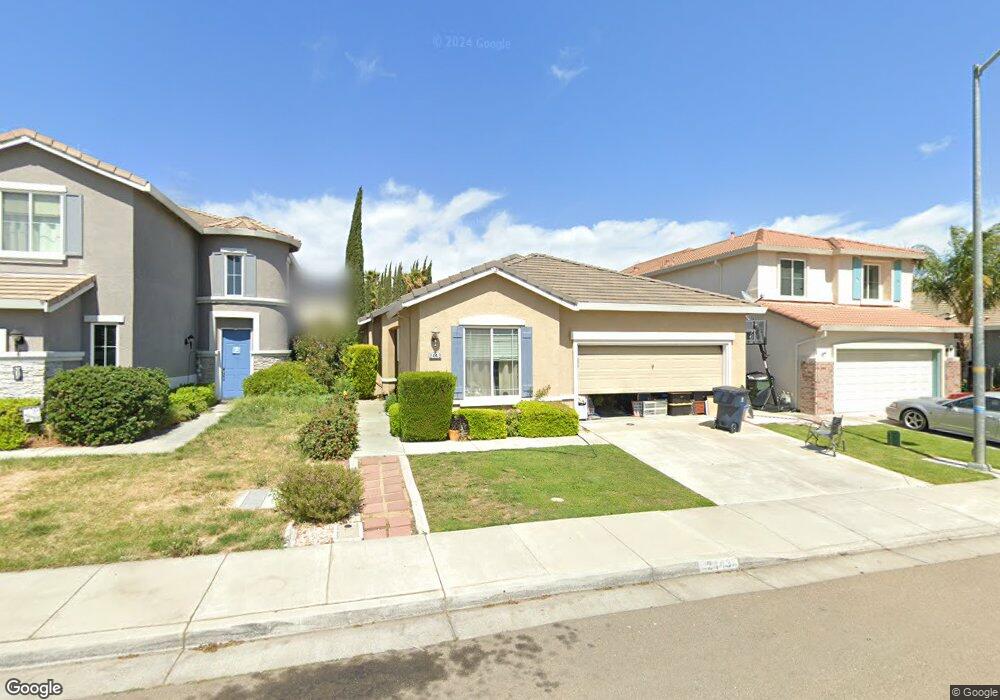
This home is located at 2443 Colby Ct, Tracy, CA 95377 and is currently estimated at $636,028, approximately $420 per square foot. 2443 Colby Ct is a home located in San Joaquin County with nearby schools including George Kelly Elementary School, John C. Kimball High School, and Tracy Independent Study Charter School.
Ownership History
Date
Name
Owned For
Owner Type
Purchase Details
Closed on
Oct 12, 2007
Sold by
Dawson Michael E and Dawson Julie L
Bought by
Dawson Michael E and Dawson Julie L
Current Estimated Value
Purchase Details
Closed on
Feb 11, 2004
Sold by
Vo Vinh and Dinh Mai Xuan
Bought by
Dawson Michael E and Dawson Julie L
Home Financials for this Owner
Home Financials are based on the most recent Mortgage that was taken out on this home.
Original Mortgage
$284,760
Outstanding Balance
$120,557
Interest Rate
4.44%
Mortgage Type
Negative Amortization
Estimated Equity
$515,471
Purchase Details
Closed on
May 16, 2000
Sold by
Woodside Gabriel Estates Inc
Bought by
Vo Vinh and Dinh Mai Xuan
Home Financials for this Owner
Home Financials are based on the most recent Mortgage that was taken out on this home.
Original Mortgage
$215,432
Interest Rate
8.18%
Mortgage Type
FHA
Create a Home Valuation Report for This Property
The Home Valuation Report is an in-depth analysis detailing your home's value as well as a comparison with similar homes in the area
Home Values in the Area
Average Home Value in this Area
Purchase History
| Date | Buyer | Sale Price | Title Company |
|---|---|---|---|
| Dawson Michael E | -- | None Available | |
| Dawson Michael E | $356,000 | Old Republic Title Co | |
| Vo Vinh | $217,000 | First American Title Co |
Source: Public Records
Mortgage History
| Date | Status | Borrower | Loan Amount |
|---|---|---|---|
| Open | Dawson Michael E | $284,760 | |
| Previous Owner | Vo Vinh | $215,432 | |
| Closed | Dawson Michael E | $35,545 |
Source: Public Records
Tax History Compared to Growth
Tax History
| Year | Tax Paid | Tax Assessment Tax Assessment Total Assessment is a certain percentage of the fair market value that is determined by local assessors to be the total taxable value of land and additions on the property. | Land | Improvement |
|---|---|---|---|---|
| 2025 | $7,225 | $506,060 | $150,699 | $355,361 |
| 2024 | $6,728 | $496,139 | $147,745 | $348,394 |
| 2023 | $6,612 | $486,412 | $144,849 | $341,563 |
| 2022 | $6,749 | $476,875 | $142,009 | $334,866 |
| 2021 | $6,645 | $467,525 | $139,225 | $328,300 |
| 2020 | $6,582 | $462,732 | $137,798 | $324,934 |
| 2019 | $6,472 | $453,660 | $135,097 | $318,563 |
| 2018 | $6,345 | $444,766 | $132,449 | $312,317 |
| 2017 | $5,792 | $410,000 | $122,000 | $288,000 |
| 2016 | $5,482 | $371,000 | $110,000 | $261,000 |
| 2014 | $4,700 | $314,000 | $94,000 | $220,000 |
Source: Public Records
Map
Nearby Homes
- 7897 Lamplight Dr
- 2352 Gretchen Elizabeth Ct
- 313 Michael Cox Ln
- 2280 Gibralter Ln
- 723 Ann Gabriel Ln
- 2657 Green Haven Ct
- 2504 Sweetbay Cir
- 2736 Daisy Ln
- 1327 Remington Ct
- 19843-Parcel 6 Corral Hollow Rd
- 19843-Parcel 5 Corral Hollow Rd
- 2854 Redbridge Rd
- 25999 Carbona Ct
- 12060 Midway Dr
- 207 Barcelona Dr
- 1990 Harvest Landing Ct
- 2132 Tennis Ln
- 1088 Sausalito Way
- 423 Riley Ct
- 1880 Persimmon Way
- 2453 Colby Ct
- 2433 Colby Ct
- 582 Veneto Ct
- 2423 Colby Ct
- 2463 Colby Ct
- 572 Veneto Ct
- 2434 Verona Ct
- 2424 Verona Ct
- 2473 Colby Ct
- 2442 Colby Ct
- 2452 Colby Ct
- 761 Marie Angela Dr
- 2432 Colby Ct
- 741 Marie Angela Dr
- 721 Marie Angela Dr
- 562 Veneto Ct
- 2462 Colby Ct
- 2422 Colby Ct
- 701 Marie Angela Dr
- 2412 Colby Ct