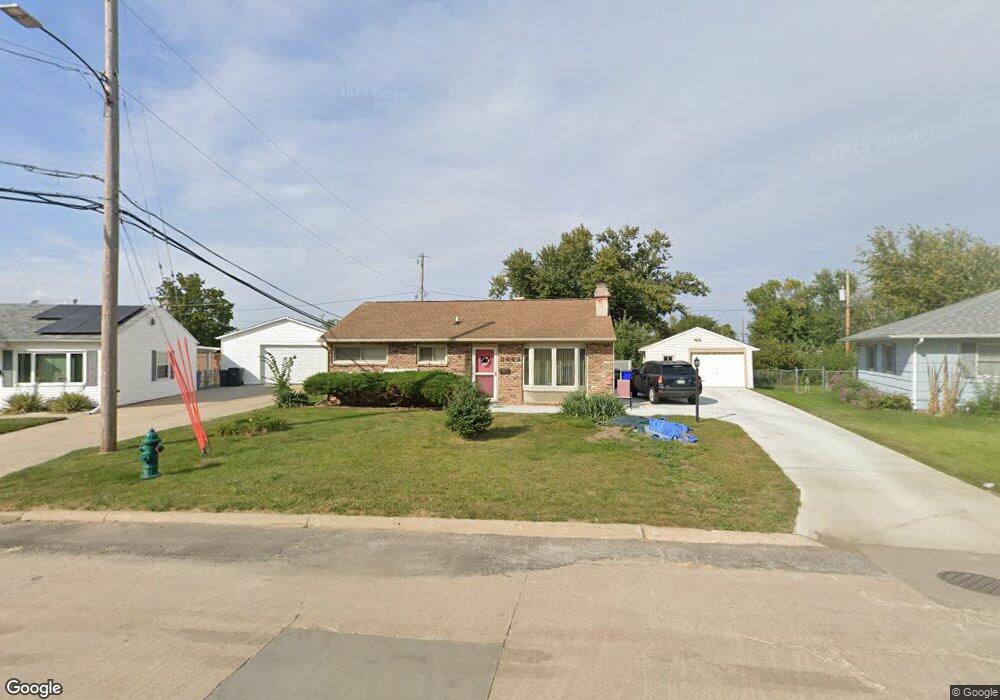
2443 Illinois St SW Cedar Rapids, IA 52404
Southwest Area NeighborhoodEstimated Value: $145,571 - $168,000
3
Beds
1
Bath
894
Sq Ft
$174/Sq Ft
Est. Value
About This Home
This home is located at 2443 Illinois St SW, Cedar Rapids, IA 52404 and is currently estimated at $155,893, approximately $174 per square foot. 2443 Illinois St SW is a home located in Linn County with nearby schools including Junction City Elementary School, Grant Elementary School, and Bruce Hall Day Treatment Center.
Ownership History
Date
Name
Owned For
Owner Type
Purchase Details
Closed on
Jan 14, 2010
Sold by
Ritchie Gaylen H
Bought by
Peters Cathy A
Current Estimated Value
Purchase Details
Closed on
Jan 4, 2010
Sold by
Ritchie Richard Douglas and Ritchie Meredith Lynn
Bought by
Ritchie Gaylen H
Purchase Details
Closed on
Nov 3, 2009
Sold by
Peters Cathy A
Bought by
Peters Cathy A and Godber Stephen
Home Financials for this Owner
Home Financials are based on the most recent Mortgage that was taken out on this home.
Original Mortgage
$84,800
Interest Rate
5.62%
Mortgage Type
New Conventional
Purchase Details
Closed on
Oct 16, 2009
Sold by
Ritchie Richard Douglas and Ritchie Meredith Lynn
Bought by
Peters Cathy A
Home Financials for this Owner
Home Financials are based on the most recent Mortgage that was taken out on this home.
Original Mortgage
$84,800
Interest Rate
5.62%
Mortgage Type
New Conventional
Purchase Details
Closed on
Oct 6, 2007
Sold by
Ritchie Gaylen H
Bought by
Ritchie Richard Douglas and Jones Scotta Lynne
Create a Home Valuation Report for This Property
The Home Valuation Report is an in-depth analysis detailing your home's value as well as a comparison with similar homes in the area
Home Values in the Area
Average Home Value in this Area
Purchase History
| Date | Buyer | Sale Price | Title Company |
|---|---|---|---|
| Peters Cathy A | -- | None Available | |
| Ritchie Gaylen H | -- | None Available | |
| Peters Cathy A | -- | None Available | |
| Peters Cathy A | $105,500 | None Available | |
| Ritchie Richard Douglas | -- | None Available |
Source: Public Records
Mortgage History
| Date | Status | Borrower | Loan Amount |
|---|---|---|---|
| Previous Owner | Peters Cathy A | $84,800 |
Source: Public Records
Tax History Compared to Growth
Tax History
| Year | Tax Paid | Tax Assessment Tax Assessment Total Assessment is a certain percentage of the fair market value that is determined by local assessors to be the total taxable value of land and additions on the property. | Land | Improvement |
|---|---|---|---|---|
| 2025 | $1,850 | $137,500 | $30,300 | $107,200 |
| 2024 | $2,236 | $128,400 | $30,300 | $98,100 |
| 2023 | $2,236 | $122,000 | $25,500 | $96,500 |
| 2022 | $1,928 | $114,900 | $22,300 | $92,600 |
| 2021 | $1,990 | $102,000 | $22,300 | $79,700 |
| 2020 | $1,990 | $98,800 | $19,200 | $79,600 |
| 2019 | $1,758 | $90,100 | $19,200 | $70,900 |
| 2018 | $1,706 | $90,100 | $19,200 | $70,900 |
| 2017 | $1,945 | $89,500 | $19,200 | $70,300 |
| 2016 | $1,945 | $91,500 | $19,200 | $72,300 |
| 2015 | $1,825 | $85,801 | $19,156 | $66,645 |
| 2014 | $1,640 | $88,467 | $19,156 | $69,311 |
| 2013 | $1,656 | $88,467 | $19,156 | $69,311 |
Source: Public Records
Map
Nearby Homes
- 2417 Illinois St SW
- 2511 Indiana St SW
- 2536 L St SW
- 648 22nd Ave SW
- 826 21st Ave SW
- 657 16th Ave SW
- 1804 I St SW
- 1621 9th St SW
- 1617 9th St SW
- 1435 N St SW
- 186 22nd Ave SW
- 1426 N St SW
- 1132 21st Ave SW
- 815 15th Ave SW
- 1323 M St SW
- 2021 Hamilton St SW
- 280 14th Ave SW
- 1424 9th St SW
- 1300 M St SW
- 192 15th Ave SW
- 2441 Illinois St SW
- 2445 Illinois St SW
- 2404 Wisconsin St SW
- 2400 Wisconsin St SW
- 2408 Wisconsin St SW
- 2437 Illinois St SW
- 401 Linwood St SW
- 2447 Illinois St SW
- 2414 Wisconsin St SW
- 2442 Illinois St SW
- 2431 Illinois St SW
- 2418 Wisconsin St SW
- 2448 Illinois St SW
- 405 Linwood St SW
- 2438 Illinois St SW
- 2451 Illinois St SW
- 2422 Wisconsin St SW
- 2434 Illinois St SW
- 409 Linwood St SW
- 2427 Illinois St SW