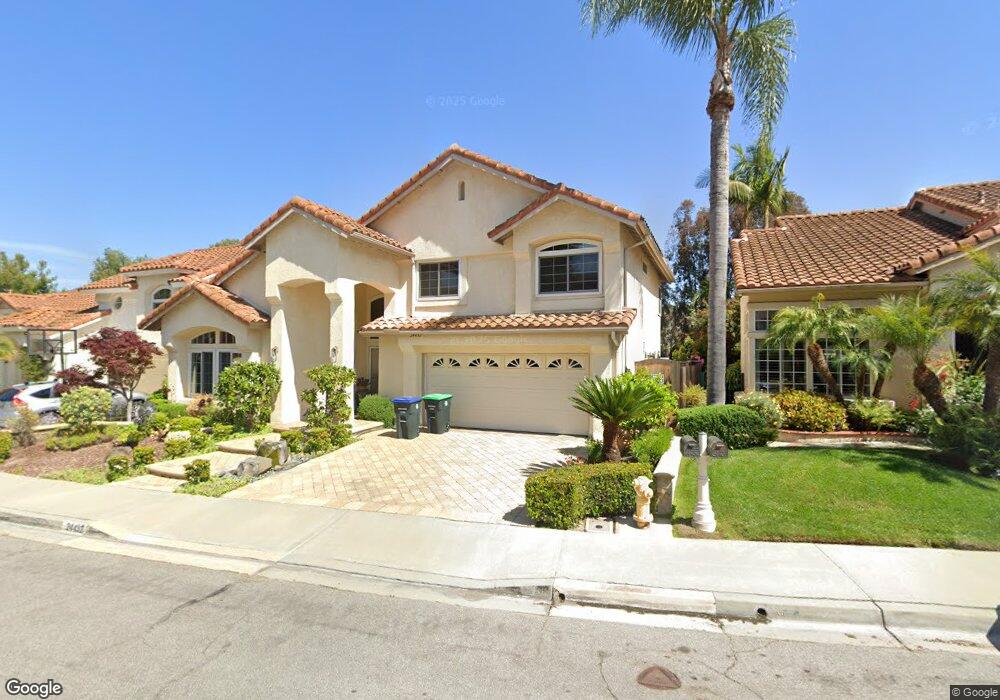
24432 Kings View Laguna Niguel, CA 92677
Estimated Value: $1,463,082 - $1,865,000
4
Beds
3
Baths
2,181
Sq Ft
$737/Sq Ft
Est. Value
About This Home
This home is located at 24432 Kings View, Laguna Niguel, CA 92677 and is currently estimated at $1,606,521, approximately $736 per square foot. 24432 Kings View is a home located in Orange County with nearby schools including Moulton Elementary, Aliso Viejo Middle School, and Aliso Niguel High School.
Ownership History
Date
Name
Owned For
Owner Type
Purchase Details
Closed on
Dec 28, 2012
Sold by
Barker Charles Starr and Barker Joanna Lynn
Bought by
Barker Charles Starr and Barker Joanna Lynn
Current Estimated Value
Purchase Details
Closed on
Jul 10, 2001
Sold by
Barnes Virginia A
Bought by
Barker Charles Starr and Barker Joanna Lynn
Home Financials for this Owner
Home Financials are based on the most recent Mortgage that was taken out on this home.
Original Mortgage
$328,800
Outstanding Balance
$124,222
Interest Rate
6.87%
Estimated Equity
$1,482,299
Purchase Details
Closed on
Feb 7, 1995
Sold by
Kui Peter and Kui Susan Gee
Bought by
Barnes Virginia A
Home Financials for this Owner
Home Financials are based on the most recent Mortgage that was taken out on this home.
Original Mortgage
$165,000
Interest Rate
4.5%
Create a Home Valuation Report for This Property
The Home Valuation Report is an in-depth analysis detailing your home's value as well as a comparison with similar homes in the area
Home Values in the Area
Average Home Value in this Area
Purchase History
| Date | Buyer | Sale Price | Title Company |
|---|---|---|---|
| Barker Charles Starr | -- | None Available | |
| Barker Charles Starr | $411,000 | American Title Co | |
| Barnes Virginia A | $260,000 | Guardian Title Company |
Source: Public Records
Mortgage History
| Date | Status | Borrower | Loan Amount |
|---|---|---|---|
| Open | Barker Charles Starr | $328,800 | |
| Previous Owner | Barnes Virginia A | $165,000 |
Source: Public Records
Tax History Compared to Growth
Tax History
| Year | Tax Paid | Tax Assessment Tax Assessment Total Assessment is a certain percentage of the fair market value that is determined by local assessors to be the total taxable value of land and additions on the property. | Land | Improvement |
|---|---|---|---|---|
| 2025 | $6,042 | $607,158 | $361,297 | $245,861 |
| 2024 | $6,042 | $595,253 | $354,212 | $241,041 |
| 2023 | $5,914 | $583,582 | $347,267 | $236,315 |
| 2022 | $5,801 | $572,140 | $340,458 | $231,682 |
| 2021 | $5,689 | $560,922 | $333,782 | $227,140 |
| 2020 | $5,633 | $555,171 | $330,360 | $224,811 |
| 2019 | $5,522 | $544,286 | $323,883 | $220,403 |
| 2018 | $5,416 | $533,614 | $317,532 | $216,082 |
| 2017 | $5,310 | $523,151 | $311,305 | $211,846 |
| 2016 | $5,209 | $512,894 | $305,201 | $207,693 |
| 2015 | $5,130 | $505,190 | $300,616 | $204,574 |
| 2014 | $5,032 | $495,295 | $294,728 | $200,567 |
Source: Public Records
Map
Nearby Homes
- 1 O'Hill
- 24615 Kings Rd
- 24625 Los Serranos Dr
- 24705 Queens Ct
- 29181 Via San Sebastian
- 24561 Los Serranos Dr
- 29162 Bobolink Dr
- 29141 Bobolink Dr
- 24877 Nueva Vista Dr Unit 23
- 24839 Nueva Vista Dr Unit 5
- 24822 Cutter
- 30042 Oceanus
- 24471 Los Serranos Dr
- 25111 Adelanto Dr
- 23971 Stillwater Ln
- 24235 Via Aquara Ave
- 25112 Armagosa Dr
- 28793 El Adolfo
- 29546 Pelican Way
- 25085 Sanoria St
- 24442 Kings View
- 24422 Kings View
- 24452 Kings View
- 24416 Kings View
- 29525 Crown Creek
- 29531 Crown Creek
- 29521 Crown Creek
- 29541 Crown Creek
- 24441 Kings View
- 24431 Kings View
- 24412 Kings View
- 24456 Kings View
- 24451 Kings View
- 24421 Kings View
- 29551 Crown Creek
- 29515 Crown Creek
- 24455 Kings View
- 24406 Kings View
- 29561 Crown Creek
- 24462 Kings View