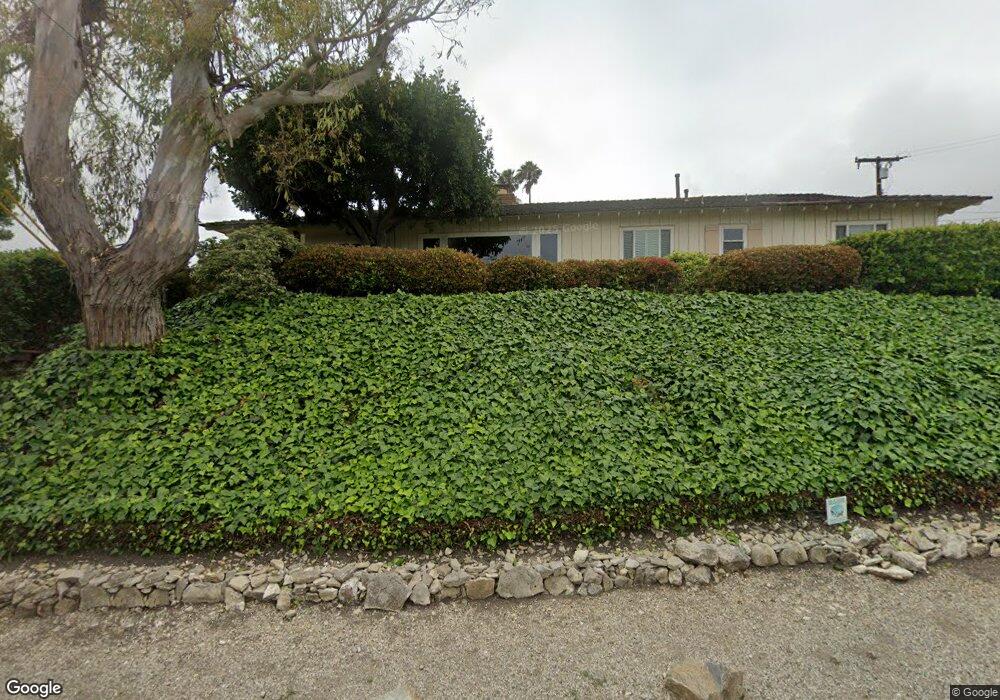
2444 Sunnyside Ridge Rd Rancho Palos Verdes, CA 90275
Estimated Value: $1,571,611 - $1,884,000
3
Beds
3
Baths
2,073
Sq Ft
$823/Sq Ft
Est. Value
About This Home
This home is located at 2444 Sunnyside Ridge Rd, Rancho Palos Verdes, CA 90275 and is currently estimated at $1,706,403, approximately $823 per square foot. 2444 Sunnyside Ridge Rd is a home located in Los Angeles County with nearby schools including Dapplegray Elementary School, Miraleste Intermediate, and Palos Verdes Peninsula High School.
Ownership History
Date
Name
Owned For
Owner Type
Purchase Details
Closed on
Sep 17, 2019
Sold by
Whyte Carol A
Bought by
Whyte Carol A and Carol A Whyte Family Trust
Current Estimated Value
Purchase Details
Closed on
Jul 1, 2019
Sold by
Whyte Carol A and The Rowe Famfly Trust
Bought by
Whyte Carol A
Home Financials for this Owner
Home Financials are based on the most recent Mortgage that was taken out on this home.
Original Mortgage
$465,000
Interest Rate
3.82%
Mortgage Type
New Conventional
Purchase Details
Closed on
Mar 25, 2015
Sold by
Rowe Gilbert Thorton and Rowe Gilbert T
Bought by
Rowe Gilbert T and Rowe Family Trust
Purchase Details
Closed on
Feb 12, 2015
Sold by
Rowe Mary Jane and Rowe Gilbert Thornton
Bought by
Rowe Gilbert T
Purchase Details
Closed on
Feb 6, 1997
Sold by
Rowe Gilbert T and Rowe Mary J
Bought by
Rowe Gilbert T and Rowe Mary Jane
Create a Home Valuation Report for This Property
The Home Valuation Report is an in-depth analysis detailing your home's value as well as a comparison with similar homes in the area
Home Values in the Area
Average Home Value in this Area
Purchase History
| Date | Buyer | Sale Price | Title Company |
|---|---|---|---|
| Whyte Carol A | -- | None Available | |
| Whyte Carol A | -- | Lawyers Title | |
| Rowe Gilbert T | -- | None Available | |
| Rowe Gilbert T | -- | None Available | |
| Rowe Gilbert T | -- | -- | |
| Rowe Gilbert T | -- | -- |
Source: Public Records
Mortgage History
| Date | Status | Borrower | Loan Amount |
|---|---|---|---|
| Previous Owner | Whyte Carol A | $465,000 |
Source: Public Records
Tax History Compared to Growth
Tax History
| Year | Tax Paid | Tax Assessment Tax Assessment Total Assessment is a certain percentage of the fair market value that is determined by local assessors to be the total taxable value of land and additions on the property. | Land | Improvement |
|---|---|---|---|---|
| 2025 | $3,242 | $207,057 | $82,347 | $124,710 |
| 2024 | $3,242 | $202,998 | $80,733 | $122,265 |
| 2023 | $3,097 | $199,018 | $79,150 | $119,868 |
| 2022 | $2,963 | $195,117 | $77,599 | $117,518 |
| 2021 | $2,922 | $191,292 | $76,078 | $115,214 |
| 2020 | $2,423 | $189,331 | $75,298 | $114,033 |
| 2019 | $2,353 | $185,620 | $73,822 | $111,798 |
| 2018 | $2,175 | $181,981 | $72,375 | $109,606 |
| 2017 | $2,134 | $178,413 | $70,956 | $107,457 |
| 2016 | $2,463 | $174,915 | $69,565 | $105,350 |
| 2015 | $2,225 | $172,289 | $68,521 | $103,768 |
| 2014 | $2,218 | $168,915 | $67,179 | $101,736 |
Source: Public Records
Map
Nearby Homes
- 27772 Palos Verdes Dr E
- 28056 Palos Verdes Dr E
- 20 Saddle Rd
- 27846 Palos Verdes Dr E
- 2030 Galerita Dr
- 2109 Avenida Aprenda
- 6 Toprail Ln
- 1808 Velez Dr
- 0 Redondela Dr
- 0 Avenida Aprenda
- 1990 Avenida Feliciano
- 6441 Via de Anzar
- 28534 Bearhaven Ct
- 28745 N Enrose Ave
- 2214 Via Velardo
- 14 Bronco Dr
- 1690 Coral Sea Ln
- 0 Crownview Dr Unit SW25229678
- 0 Crownview Dr Unit SW25229669
- 0 Crownview Dr Unit DW23177044
- 27914 Sol Vista Ln
- 2424 Sunnyside Ridge Rd
- 27928 Sol Vista Ln
- 2443 Sunnyside Ridge Rd
- 2414 Sunnyside Ridge Rd
- 2417 Sunnyside Ridge Rd
- 2407 Sunnyside Ridge Rd
- 2477 Sunnyside Ridge Rd
- 27936 Sol Vista Ln
- 2404 Sunnyside Ridge Rd
- 2507 Sunnyside Ridge Rd
- 2343 Sunnyside Ridge Rd
- 2534 Sunnyside Ridge Rd
- 2348 Sunnyside Ridge Rd
- 2320 Sunnyside Ridge Rd
- 2542 Sunnyside Ridge Rd
- 2513 Sunnyside Ridge Rd
- 19 Stirrup Rd
- 2331 Sunnyside Ridge Rd
- 17 Stirrup Rd