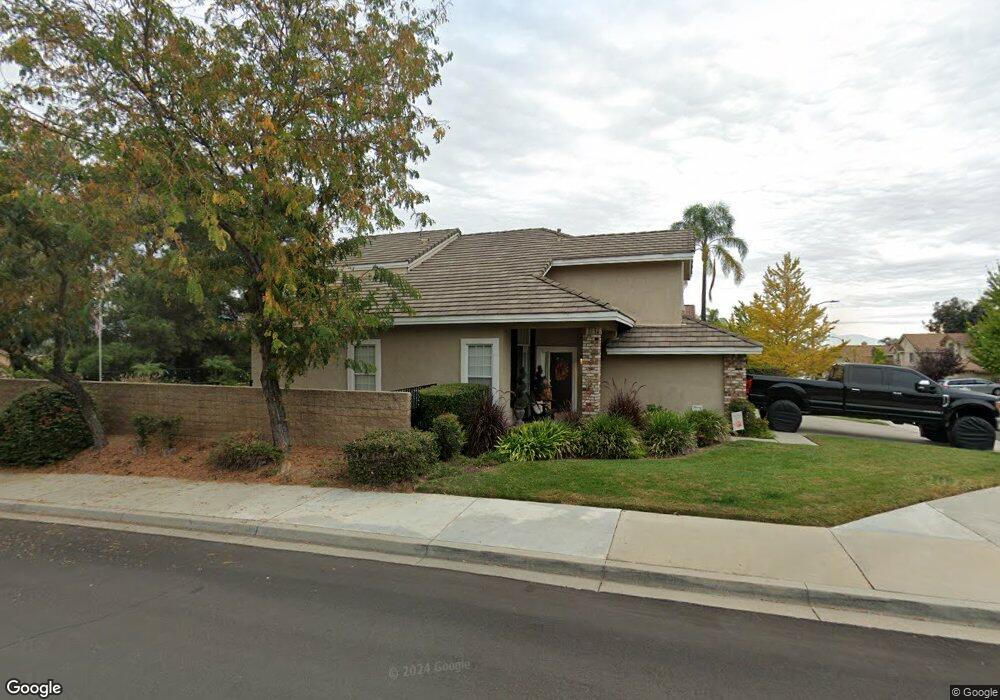
2444 Via la Mesa Chino Hills, CA 91709
North Chino Hills NeighborhoodEstimated Value: $1,161,874 - $1,320,000
5
Beds
3
Baths
2,438
Sq Ft
$511/Sq Ft
Est. Value
About This Home
This home is located at 2444 Via la Mesa, Chino Hills, CA 91709 and is currently estimated at $1,244,969, approximately $510 per square foot. 2444 Via la Mesa is a home located in San Bernardino County with nearby schools including Hidden Trails Elementary School, Canyon Hills Junior High School, and Ruben S. Ayala High School.
Ownership History
Date
Name
Owned For
Owner Type
Purchase Details
Closed on
Jul 25, 2022
Sold by
Maurer Tom and Maurer Trina M
Bought by
Maurer Family Revocable Living Trust
Current Estimated Value
Purchase Details
Closed on
Apr 5, 2000
Sold by
Barrientos Fidelino D and Barrientos Sol G
Bought by
Maurer Tom and Maurer Trina M
Home Financials for this Owner
Home Financials are based on the most recent Mortgage that was taken out on this home.
Original Mortgage
$270,400
Interest Rate
8.24%
Purchase Details
Closed on
Jul 26, 1993
Sold by
Brock Coral Ridge
Bought by
Barrientos Fidelino D and Barrientos Sol G
Home Financials for this Owner
Home Financials are based on the most recent Mortgage that was taken out on this home.
Original Mortgage
$236,650
Interest Rate
6.81%
Create a Home Valuation Report for This Property
The Home Valuation Report is an in-depth analysis detailing your home's value as well as a comparison with similar homes in the area
Home Values in the Area
Average Home Value in this Area
Purchase History
| Date | Buyer | Sale Price | Title Company |
|---|---|---|---|
| Maurer Family Revocable Living Trust | -- | None Listed On Document | |
| Maurer Tom | $338,000 | Chicago Title Co | |
| Barrientos Fidelino D | $263,000 | First American Title Insuran |
Source: Public Records
Mortgage History
| Date | Status | Borrower | Loan Amount |
|---|---|---|---|
| Previous Owner | Maurer Tom | $270,400 | |
| Previous Owner | Barrientos Fidelino D | $236,650 |
Source: Public Records
Tax History Compared to Growth
Tax History
| Year | Tax Paid | Tax Assessment Tax Assessment Total Assessment is a certain percentage of the fair market value that is determined by local assessors to be the total taxable value of land and additions on the property. | Land | Improvement |
|---|---|---|---|---|
| 2025 | $6,062 | $519,506 | $181,826 | $337,680 |
| 2024 | $6,062 | $509,320 | $178,261 | $331,059 |
| 2023 | $5,907 | $499,334 | $174,766 | $324,568 |
| 2022 | $5,874 | $489,543 | $171,339 | $318,204 |
| 2021 | $5,768 | $479,944 | $167,979 | $311,965 |
| 2020 | $5,699 | $475,023 | $166,257 | $308,766 |
| 2019 | $5,606 | $465,709 | $162,997 | $302,712 |
| 2018 | $6,092 | $456,577 | $159,801 | $296,776 |
| 2017 | $5,990 | $447,625 | $156,668 | $290,957 |
| 2016 | $5,655 | $438,848 | $153,596 | $285,252 |
| 2015 | $5,551 | $432,256 | $151,289 | $280,967 |
| 2014 | $5,450 | $423,788 | $148,325 | $275,463 |
Source: Public Records
Map
Nearby Homes
- 15075 Avenida Del Monte
- 15050 Avenida de Las Flores
- 2509 Moon Dust Dr Unit A
- 15030 Camino Arroyo
- 2475 Moon Dust Dr Unit B
- 15429 Turquoise Cir N
- 2516 Sundial Dr Unit B
- 14748 Moon Crest Ln Unit E
- 15358 Morningside Dr
- 2153 Turquoise Cir
- 3107 Morningside Dr
- 2460 Windmill Creek Rd
- 0 Valle Vista Dr
- 2891 Galloping Hills Rd
- 2222 Carbon Canyon Rd
- 2417 Brookhaven Dr
- 1850 Fairway Dr Unit 48
- 1850 Fairway Dr Unit 47
- 3159 Morningfield Dr
- 3167 Morningfield Dr
- 2452 Via la Mesa
- 2458 Via la Mesa
- 2426 Via la Mesa
- 2447 Via la Mesa
- 2435 Via la Mesa
- 2468 Via la Mesa
- 2455 Via la Mesa
- 2429 Via la Mesa
- 2418 Via la Mesa
- 2426 Paseo Del Palacio
- 2436 Paseo Del Palacio
- 2461 Via la Mesa
- 2420 Paseo Del Palacio
- 2444 Paseo Del Palacio
- 2419 Via la Mesa
- 2474 Via la Mesa
- 2412 Paseo Del Palacio
- 2408 Via la Mesa
- 2473 Via la Mesa
- 2452 Paseo Del Palacio