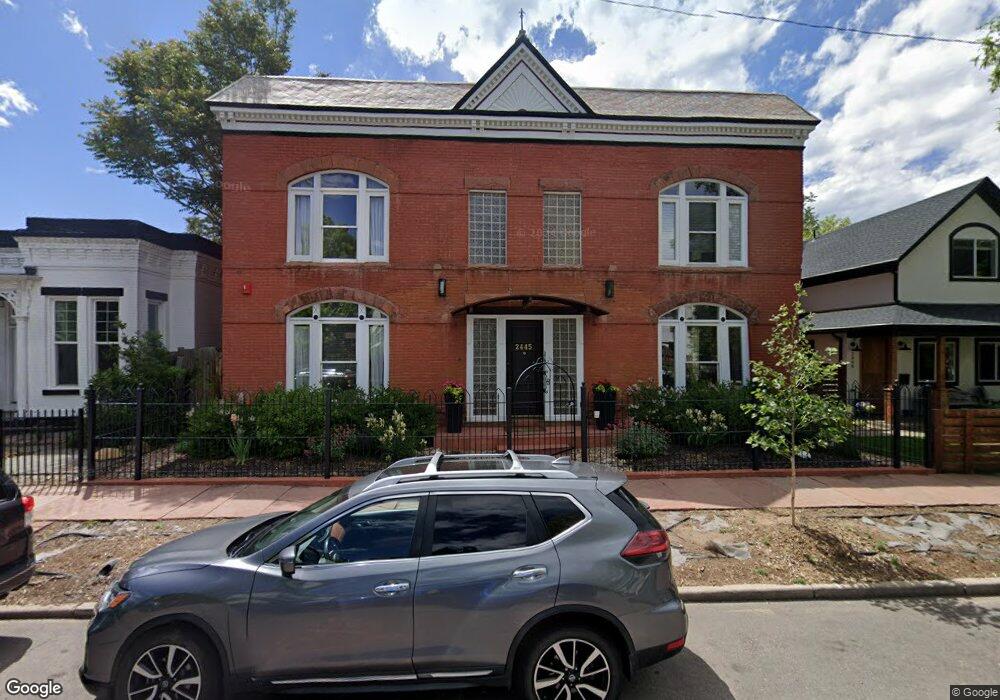
2445 Clarkson St Unit 1 Denver, CO 80205
Five Points NeighborhoodEstimated Value: $480,189 - $649,000
2
Beds
2
Baths
1,101
Sq Ft
$510/Sq Ft
Est. Value
About This Home
This home is located at 2445 Clarkson St Unit 1, Denver, CO 80205 and is currently estimated at $561,297, approximately $509 per square foot. 2445 Clarkson St Unit 1 is a home located in Denver County with nearby schools including Whittier ECE-8 School, Cole Arts & Science Academy, and McAuliffe Manual Middle School.
Ownership History
Date
Name
Owned For
Owner Type
Purchase Details
Closed on
Jul 18, 2007
Sold by
Wittman Chad
Bought by
Patsey Joshua M and Patsey Elizabeth A
Current Estimated Value
Home Financials for this Owner
Home Financials are based on the most recent Mortgage that was taken out on this home.
Original Mortgage
$261,000
Outstanding Balance
$186,743
Interest Rate
9.5%
Mortgage Type
New Conventional
Estimated Equity
$374,554
Purchase Details
Closed on
Apr 30, 2004
Sold by
Duggan Rhys
Bought by
Wittman Chad
Home Financials for this Owner
Home Financials are based on the most recent Mortgage that was taken out on this home.
Original Mortgage
$216,000
Interest Rate
4.87%
Mortgage Type
Purchase Money Mortgage
Purchase Details
Closed on
Nov 7, 2000
Sold by
Hulme Todd Alton
Bought by
Duggan Rhys
Home Financials for this Owner
Home Financials are based on the most recent Mortgage that was taken out on this home.
Original Mortgage
$193,500
Interest Rate
7.9%
Create a Home Valuation Report for This Property
The Home Valuation Report is an in-depth analysis detailing your home's value as well as a comparison with similar homes in the area
Home Values in the Area
Average Home Value in this Area
Purchase History
| Date | Buyer | Sale Price | Title Company |
|---|---|---|---|
| Patsey Joshua M | $290,000 | Land Title Guarantee Company | |
| Wittman Chad | $270,000 | Title America | |
| Duggan Rhys | $212,000 | North American Title Co |
Source: Public Records
Mortgage History
| Date | Status | Borrower | Loan Amount |
|---|---|---|---|
| Open | Patsey Joshua M | $261,000 | |
| Previous Owner | Wittman Chad | $216,000 | |
| Previous Owner | Duggan Rhys | $193,500 |
Source: Public Records
Tax History Compared to Growth
Tax History
| Year | Tax Paid | Tax Assessment Tax Assessment Total Assessment is a certain percentage of the fair market value that is determined by local assessors to be the total taxable value of land and additions on the property. | Land | Improvement |
|---|---|---|---|---|
| 2024 | $2,651 | $33,470 | $3,340 | $30,130 |
| 2023 | $2,593 | $33,470 | $3,340 | $30,130 |
| 2022 | $2,360 | $29,680 | $6,900 | $22,780 |
| 2021 | $2,279 | $30,540 | $7,100 | $23,440 |
| 2020 | $2,418 | $32,590 | $5,130 | $27,460 |
| 2019 | $2,350 | $32,590 | $5,130 | $27,460 |
| 2018 | $2,331 | $30,130 | $5,160 | $24,970 |
| 2017 | $2,324 | $30,130 | $5,160 | $24,970 |
| 2016 | $2,729 | $33,460 | $2,635 | $30,825 |
| 2015 | $2,614 | $33,460 | $2,635 | $30,825 |
| 2014 | $1,983 | $23,880 | $2,452 | $21,428 |
Source: Public Records
Map
Nearby Homes
- 2428 Clarkson St
- 2395 Emerson St
- 2351 Emerson St
- 505 E 24th Ave Unit 204
- 2330 N Emerson St
- 2446 N Ogden St
- 2442 N Ogden St
- 2450 N Ogden St
- 724 E 23rd Ave
- 2252 N Washington St
- 2711 Welton St Unit 201
- 2222 N Washington St
- 1021 E 23rd Ave
- 2426 Welton St
- 2201 N Ogden St Unit 1
- 1211 E 26th Ave
- 709 27th St
- 2311 N Marion St
- 924 E 22nd Ave
- 2731 California St
- 2445 Clarkson St Unit 4
- 2445 Clarkson St Unit 3
- 2445 Clarkson St Unit 2
- 2445 N Clarkson St
- 2449 Clarkson St
- 2437 Clarkson St
- 2435 Clarkson St
- 2459 Clarkson St
- 2429 Clarkson St
- 726 E 25th Ave
- 2425 Clarkson St
- 2425 N Clarkson St
- 2440 N Washington St
- 2423 Clarkson St
- 2440 Clarkson St
- 2438 Clarkson St
- 2434 Clarkson St
- 2438 N Washington St
- 2438 N Washington St
- 2444 Clarkson St