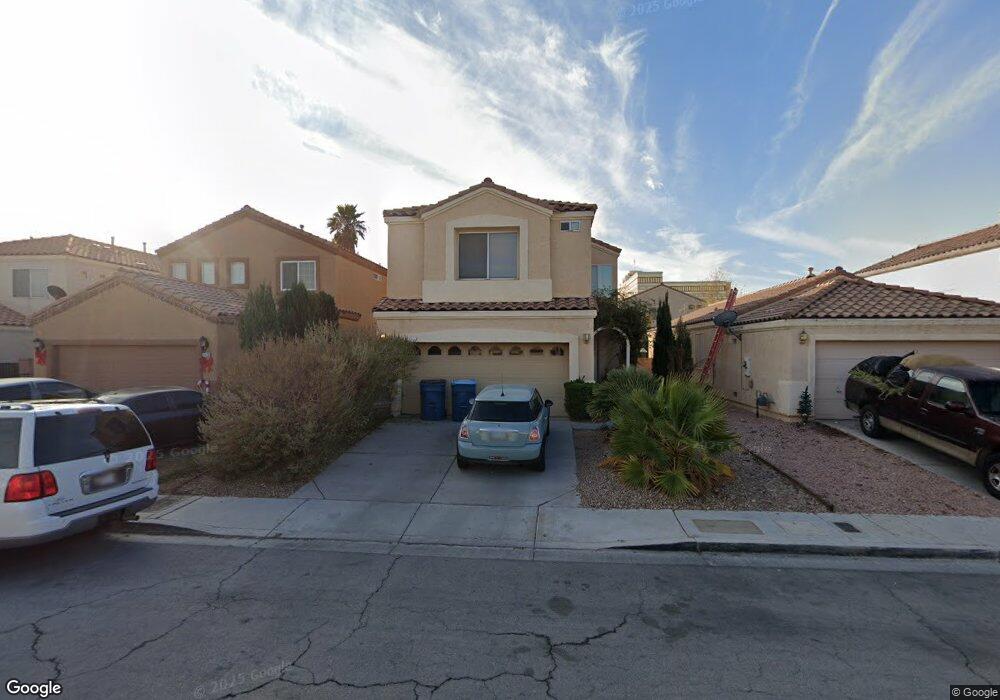
2445 Covered Wells Ave Las Vegas, NV 89123
Silverado Ranch NeighborhoodEstimated Value: $394,000 - $458,000
3
Beds
3
Baths
1,700
Sq Ft
$244/Sq Ft
Est. Value
About This Home
This home is located at 2445 Covered Wells Ave, Las Vegas, NV 89123 and is currently estimated at $415,309, approximately $244 per square foot. 2445 Covered Wells Ave is a home located in Clark County with nearby schools including John R. Hummel Elementary School, Charles Silvestri Junior High School, and Liberty High School.
Ownership History
Date
Name
Owned For
Owner Type
Purchase Details
Closed on
Nov 21, 2011
Sold by
Bank Of America N A
Bought by
Jang Graham
Current Estimated Value
Purchase Details
Closed on
Apr 19, 2011
Sold by
Peralta Asuncion A
Bought by
Bac Home Loans Servicing Lp and Countrywide Home Loans Servicing Lp
Purchase Details
Closed on
Aug 11, 2005
Sold by
Peralta Asuncion A
Bought by
Luna Amelie A and Domingo Aurora A
Purchase Details
Closed on
Jul 3, 1997
Sold by
Brown Peter Forsythe
Bought by
Brown Olga S
Purchase Details
Closed on
Apr 2, 1997
Sold by
Park Pacific Ltd Partnership
Bought by
Brown Olga S and Brown Adamchevska
Home Financials for this Owner
Home Financials are based on the most recent Mortgage that was taken out on this home.
Original Mortgage
$112,464
Interest Rate
7.58%
Mortgage Type
FHA
Create a Home Valuation Report for This Property
The Home Valuation Report is an in-depth analysis detailing your home's value as well as a comparison with similar homes in the area
Home Values in the Area
Average Home Value in this Area
Purchase History
| Date | Buyer | Sale Price | Title Company |
|---|---|---|---|
| Jang Graham | $108,000 | First American Title Paseo | |
| Bac Home Loans Servicing Lp | $144,254 | Accommodation | |
| Luna Amelie A | $135,000 | -- | |
| Brown Olga S | -- | Old Republic Title Company | |
| Brown Olga S | $122,000 | Old Republic Title Company |
Source: Public Records
Mortgage History
| Date | Status | Borrower | Loan Amount |
|---|---|---|---|
| Previous Owner | Brown Olga S | $112,464 |
Source: Public Records
Tax History Compared to Growth
Tax History
| Year | Tax Paid | Tax Assessment Tax Assessment Total Assessment is a certain percentage of the fair market value that is determined by local assessors to be the total taxable value of land and additions on the property. | Land | Improvement |
|---|---|---|---|---|
| 2025 | $1,845 | $91,852 | $36,400 | $55,452 |
| 2024 | $1,709 | $91,852 | $36,400 | $55,452 |
| 2023 | $1,709 | $81,416 | $28,700 | $52,716 |
| 2022 | $1,582 | $73,529 | $25,200 | $48,329 |
| 2021 | $1,465 | $69,225 | $23,100 | $46,125 |
| 2020 | $1,358 | $68,961 | $23,100 | $45,861 |
| 2019 | $1,272 | $63,124 | $17,850 | $45,274 |
| 2018 | $1,214 | $58,785 | $15,400 | $43,385 |
| 2017 | $1,712 | $58,381 | $14,350 | $44,031 |
| 2016 | $1,138 | $54,646 | $10,500 | $44,146 |
| 2015 | $1,134 | $45,119 | $8,050 | $37,069 |
| 2014 | $1,099 | $40,353 | $5,250 | $35,103 |
Source: Public Records
Map
Nearby Homes
- 2615 W Gary Ave Unit 2054
- 2615 W Gary Ave Unit 2067
- 2615 W Gary Ave Unit 2051
- 2615 W Gary Ave Unit 2013
- 9572 Belle Rich St
- 50 Belle La Blanc Ave
- 2405 W Serene Ave Unit 827
- 2405 W Serene Ave Unit 807
- 2405 W Serene Ave Unit 843
- 2405 W Serene Ave Unit 241
- 2405 W Serene Ave Unit 627
- 2405 W Serene Ave Unit 612
- 2405 W Serene Ave Unit 703
- 2455 W Serene Ave Unit 923
- 2455 W Serene Ave Unit 603
- 59 Belle Maison Ave
- 56 Belle Ridge Ave
- 70 Belle Essence Ave
- 20 E Serene Ave Unit 104
- 20 E Serene Ave Unit 404
- 2433 Covered Wells Ave
- 2457 Covered Wells Ave
- 2469 Covered Wells Ave
- 2421 Covered Wells Ave
- 2444 Fresnal Canyon Ave
- 2432 Fresnal Canyon Ave
- 2485 Covered Wells Ave
- 2456 Fresnal Canyon Ave
- 2420 Fresnal Canyon Ave
- 2468 Fresnal Canyon Ave
- 2444 Covered Wells Ave
- 2486 Fresnal Canyon Ave
- 2456 Covered Wells Ave
- 2432 Covered Wells Ave
- 2468 Covered Wells Ave
- 2420 Covered Wells Ave
- 2500 Fresnal Canyon Ave
- 2484 Covered Wells Ave
- 2511 Covered Wells Ave