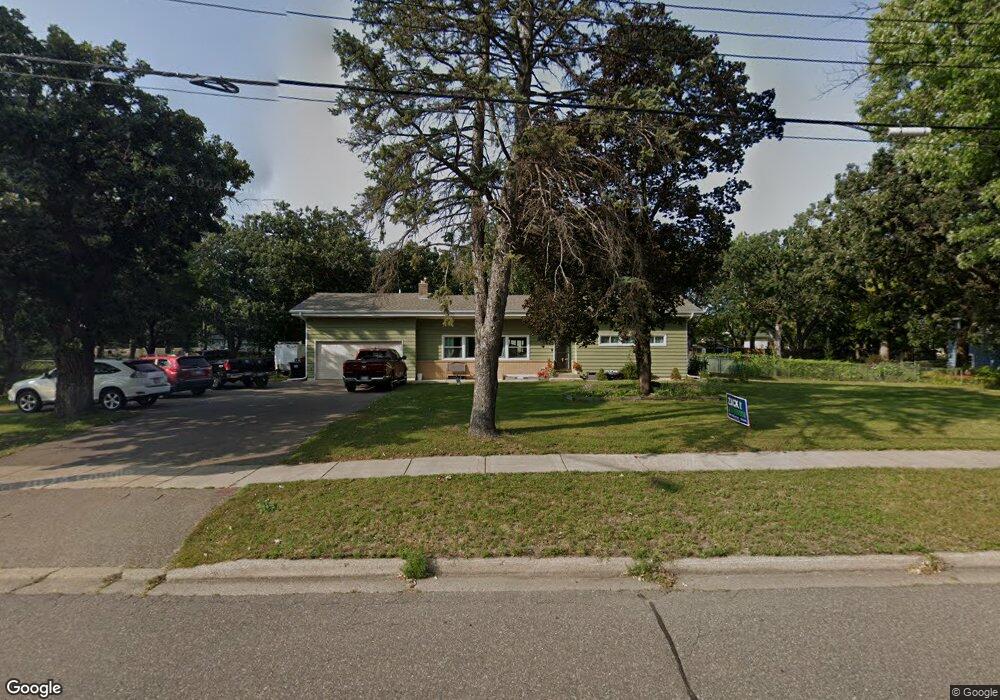
2445 Northdale Blvd NW Coon Rapids, MN 55433
Estimated Value: $357,000 - $392,514
4
Beds
2
Baths
1,416
Sq Ft
$264/Sq Ft
Est. Value
About This Home
This home is located at 2445 Northdale Blvd NW, Coon Rapids, MN 55433 and is currently estimated at $374,379, approximately $264 per square foot. 2445 Northdale Blvd NW is a home located in Anoka County with nearby schools including Morris Bye Elementary School, Coon Rapids Middle School, and Coon Rapids Senior High School.
Ownership History
Date
Name
Owned For
Owner Type
Purchase Details
Closed on
Aug 30, 2018
Sold by
Vymola Dori A and Vymola Brian
Bought by
Xiong Chia and Xiong Victoria
Current Estimated Value
Home Financials for this Owner
Home Financials are based on the most recent Mortgage that was taken out on this home.
Original Mortgage
$251,750
Outstanding Balance
$219,089
Interest Rate
4.5%
Mortgage Type
New Conventional
Estimated Equity
$155,290
Purchase Details
Closed on
Jun 11, 2009
Sold by
Julkowski Gary and Julkowski Doreen
Bought by
Vymoke Dori A
Home Financials for this Owner
Home Financials are based on the most recent Mortgage that was taken out on this home.
Original Mortgage
$172,812
Interest Rate
5.5%
Mortgage Type
FHA
Purchase Details
Closed on
Jun 9, 2008
Sold by
Bank Of Ny
Bought by
Julkowski Gary
Purchase Details
Closed on
Nov 24, 1999
Sold by
Jensen Elvira A
Bought by
Jensen Jeffrey
Create a Home Valuation Report for This Property
The Home Valuation Report is an in-depth analysis detailing your home's value as well as a comparison with similar homes in the area
Home Values in the Area
Average Home Value in this Area
Purchase History
| Date | Buyer | Sale Price | Title Company |
|---|---|---|---|
| Xiong Chia | $265,000 | Titlesmart Inc | |
| Vymoke Dori A | $176,000 | -- | |
| Julkowski Gary | $94,900 | -- | |
| Jensen Jeffrey | $125,000 | -- |
Source: Public Records
Mortgage History
| Date | Status | Borrower | Loan Amount |
|---|---|---|---|
| Open | Xiong Chia | $251,750 | |
| Previous Owner | Vymoke Dori A | $172,812 |
Source: Public Records
Tax History Compared to Growth
Tax History
| Year | Tax Paid | Tax Assessment Tax Assessment Total Assessment is a certain percentage of the fair market value that is determined by local assessors to be the total taxable value of land and additions on the property. | Land | Improvement |
|---|---|---|---|---|
| 2025 | $3,575 | $383,600 | $96,400 | $287,200 |
| 2024 | $3,575 | $342,000 | $99,800 | $242,200 |
| 2023 | $3,253 | $330,200 | $87,200 | $243,000 |
| 2022 | $3,065 | $333,100 | $76,900 | $256,200 |
| 2021 | $3,286 | $281,100 | $76,900 | $204,200 |
| 2020 | $2,719 | $264,200 | $71,100 | $193,100 |
| 2019 | $2,542 | $237,100 | $68,900 | $168,200 |
| 2018 | $2,435 | $217,100 | $0 | $0 |
| 2017 | $2,109 | $203,000 | $0 | $0 |
| 2016 | $2,115 | $173,500 | $0 | $0 |
| 2015 | -- | $173,500 | $51,600 | $121,900 |
| 2014 | -- | $153,000 | $52,500 | $100,500 |
Source: Public Records
Map
Nearby Homes
- 11809 Zion St NW
- 11835 Crocus St NW
- 11749 Crooked Lake Blvd NW
- 12019 Zion St NW
- 11409 Quinn St NW
- 11444 Hanson Blvd NW
- 3020 117th Ave NW
- 3074 121st Ave NW
- 11361 Jay St NW
- 11350 Jay St NW
- 11000 Swallow St NW
- 2500 110th Ave NW
- 11734 Marigold St NW
- 2068 124th Ln NW
- 1660 Northdale Blvd NW
- 11036 Hanson Blvd NW Unit 20
- 2400 108th Ave NW
- 1727 121st Ln NW
- 2186 125th Ln NW
- 2721 109th Ave NW
- 2505 Northdale Blvd NW
- 2420 Northdale Blvd NW
- 2415 Northdale Blvd NW
- 2410 Northdale Blvd NW
- 2500 Northdale Blvd NW
- 2432 118th Ave NW
- 11651 Xavis St NW
- 2424 118th Ave NW
- 2416 118th Ave NW
- 2500 118th Ave NW
- 11652 Xavis St NW
- 2513 Northdale Blvd NW
- 11656 Wren St NW
- 2401 Northdale Blvd NW
- 2408 118th Ave NW
- 2506 118th Ave NW
- 11643 Xavis St NW
- 11644 Xavis St NW
- 2400 118th Ave NW
- 2510 Northdale Blvd NW