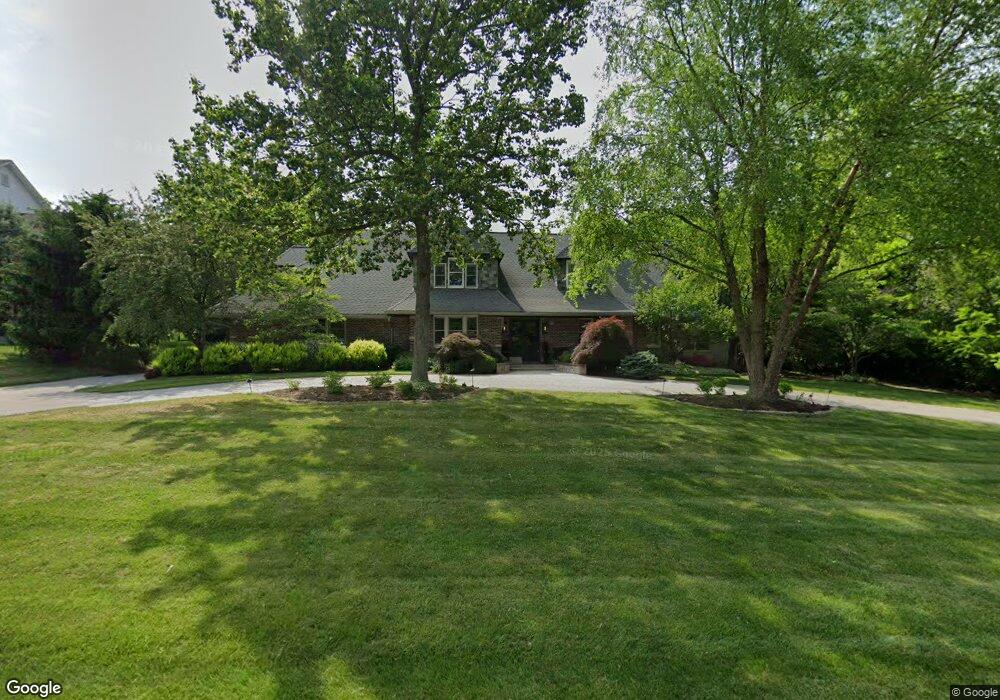
2445 Town And Country Ln Saint Louis, MO 63131
Estimated Value: $1,576,000 - $2,213,000
4
Beds
4
Baths
6,618
Sq Ft
$288/Sq Ft
Est. Value
About This Home
This home is located at 2445 Town And Country Ln, Saint Louis, MO 63131 and is currently estimated at $1,909,173, approximately $288 per square foot. 2445 Town And Country Ln is a home located in St. Louis County with nearby schools including Mason Ridge Elementary School, Parkway West Middle School, and Parkway West High School.
Ownership History
Date
Name
Owned For
Owner Type
Purchase Details
Closed on
Apr 5, 2005
Sold by
Cendant Mobility Financial Corp
Bought by
Sowers Brad M and Sowers Michele R
Current Estimated Value
Home Financials for this Owner
Home Financials are based on the most recent Mortgage that was taken out on this home.
Original Mortgage
$710,000
Outstanding Balance
$356,591
Interest Rate
5.37%
Mortgage Type
Fannie Mae Freddie Mac
Estimated Equity
$1,552,582
Purchase Details
Closed on
Aug 10, 2004
Sold by
Orr Brett W and Orr Nelly
Bought by
Cendant Mobility Financial Corp
Purchase Details
Closed on
Sep 10, 2001
Sold by
Daly Richard K and Daly Kristeen R
Bought by
Orr Brett W
Home Financials for this Owner
Home Financials are based on the most recent Mortgage that was taken out on this home.
Original Mortgage
$455,200
Interest Rate
6.96%
Create a Home Valuation Report for This Property
The Home Valuation Report is an in-depth analysis detailing your home's value as well as a comparison with similar homes in the area
Home Values in the Area
Average Home Value in this Area
Purchase History
| Date | Buyer | Sale Price | Title Company |
|---|---|---|---|
| Sowers Brad M | $960,000 | -- | |
| Cendant Mobility Financial Corp | $960,000 | -- | |
| Orr Brett W | $569,000 | -- |
Source: Public Records
Mortgage History
| Date | Status | Borrower | Loan Amount |
|---|---|---|---|
| Open | Sowers Brad M | $710,000 | |
| Previous Owner | Orr Brett W | $455,200 |
Source: Public Records
Tax History Compared to Growth
Tax History
| Year | Tax Paid | Tax Assessment Tax Assessment Total Assessment is a certain percentage of the fair market value that is determined by local assessors to be the total taxable value of land and additions on the property. | Land | Improvement |
|---|---|---|---|---|
| 2025 | $10,166 | $227,390 | $85,540 | $141,850 |
| 2024 | $10,166 | $174,750 | $76,040 | $98,710 |
| 2023 | $9,621 | $174,750 | $76,040 | $98,710 |
| 2022 | $9,884 | $163,140 | $85,540 | $77,600 |
| 2021 | $9,802 | $163,140 | $85,540 | $77,600 |
| 2020 | $8,687 | $138,250 | $85,540 | $52,710 |
| 2019 | $8,565 | $138,250 | $85,540 | $52,710 |
| 2018 | $8,733 | $130,320 | $76,040 | $54,280 |
| 2017 | $8,615 | $130,320 | $76,040 | $54,280 |
| 2016 | $10,652 | $153,180 | $66,520 | $86,660 |
| 2015 | $11,228 | $153,180 | $66,520 | $86,660 |
| 2014 | $9,523 | $141,130 | $27,570 | $113,560 |
Source: Public Records
Map
Nearby Homes
- 11 Roclare Ln
- 12549 Bickford Dr
- 29a Chapel Hill Estates Dr
- 9 Kirken Knoll Dr
- Pearson Plan at Deer Hollow - Masterpiece Collection
- Clay Plan at Deer Hollow - Masterpiece Collection
- Rhodes Plan at Deer Hollow - Masterpiece Collection
- Huxley Plan at Deer Hollow - Masterpiece Collection
- Teagan Plan at Deer Hollow - Masterpiece Collection
- Finley Plan at Deer Hollow - Masterpiece Collection
- Margot Plan at Deer Hollow - Masterpiece Collection
- Everett Plan at Deer Hollow - Masterpiece Collection
- Mitchell Plan at Deer Hollow - Masterpiece Collection
- Grayson Plan at Deer Hollow - Masterpiece Collection
- 2409 N Ballas Rd
- 0 Unknown Unit 22071090
- 1515 Topping Rd
- 5 W Point Ln
- 13 Balcon Estates Ct
- 8 Balcon Estates
- 2433 Town And Country Ln
- 2457 Town And Country Ln
- 1016 Claymark Dr
- 2444 Town And Country Ln
- 2421 Town And Country Ln
- 2511 Town And Country Ln
- 2421 Town & Country Ln
- 2432 Town And Country Ln
- 2480 Town And Country Ln
- 1000 Claymark Dr
- 1006 Claymark Dr
- 1022 Claymark Dr
- 2420 Town And Country Ln
- 2500 Town And Country Ln
- 2513 Town And Country Ln
- 1028 Claymark Dr
- 2401 Town & Country Ln
- 932 Claymark Dr
- 2401 Town And Country Ln
- 2451 Oak Springs Ln