24451 Peacock St Lake Forest, CA 92630
Estimated Value: $1,154,472 - $1,284,000
3
Beds
2
Baths
1,723
Sq Ft
$701/Sq Ft
Est. Value
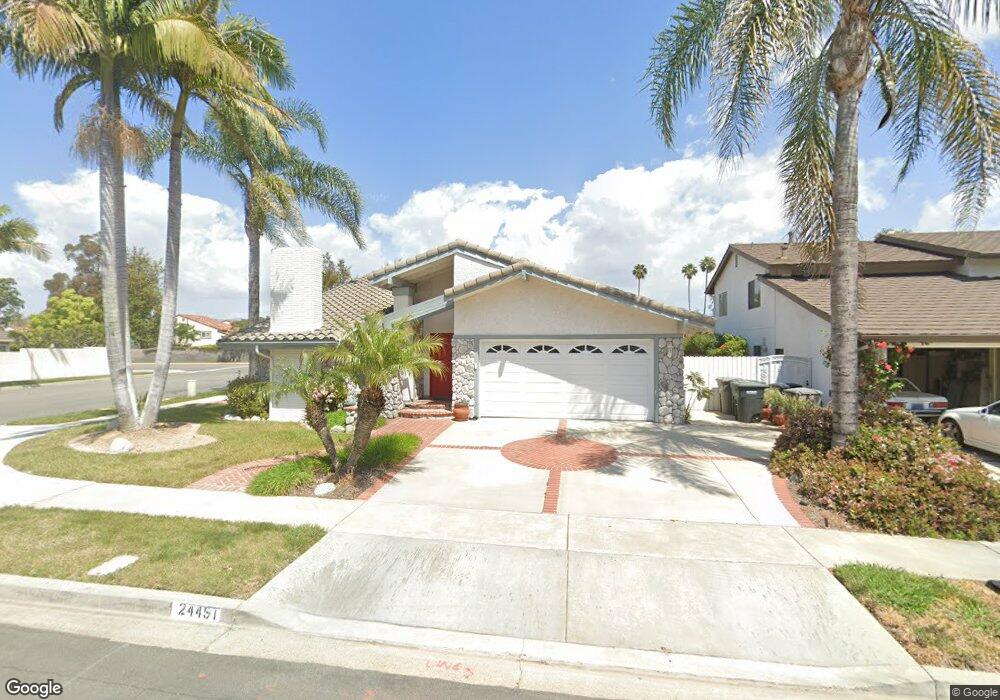
About This Home
This home is located at 24451 Peacock St, Lake Forest, CA 92630 and is currently estimated at $1,207,118, approximately $700 per square foot. 24451 Peacock St is a home located in Orange County with nearby schools including Rancho Canada Elementary School, Serrano Intermediate School, and El Toro High School.
Ownership History
Date
Name
Owned For
Owner Type
Purchase Details
Closed on
Feb 21, 2006
Sold by
Bump Peter Timothy and Bump Jennifer D
Bought by
Bump Peter Timothy and Bump Jennifer Diane
Current Estimated Value
Purchase Details
Closed on
Jul 31, 2000
Sold by
Bump Peter Timothy and Bump Jennifer D
Bought by
Bump Peter Timothy and Bump Jennifer D
Home Financials for this Owner
Home Financials are based on the most recent Mortgage that was taken out on this home.
Original Mortgage
$47,250
Outstanding Balance
$17,011
Interest Rate
8.12%
Mortgage Type
Credit Line Revolving
Estimated Equity
$1,190,107
Purchase Details
Closed on
May 6, 1998
Sold by
Manuan Kim and Jisook Kim Jisook
Bought by
Bump Peter Timothy and Bump Jennifer D
Purchase Details
Closed on
Jan 20, 1998
Sold by
Manuan Kim and Jisook Kim Jisook
Bought by
Federal National Mortgage Association
Create a Home Valuation Report for This Property
The Home Valuation Report is an in-depth analysis detailing your home's value as well as a comparison with similar homes in the area
Home Values in the Area
Average Home Value in this Area
Purchase History
| Date | Buyer | Sale Price | Title Company |
|---|---|---|---|
| Bump Peter Timothy | -- | None Available | |
| Bump Peter Timothy | -- | Lawyers Title Company | |
| Bump Peter Timothy | $195,200 | Fidelity National Title Ins | |
| Federal National Mortgage Association | $168,238 | First American Title Ins Co |
Source: Public Records
Mortgage History
| Date | Status | Borrower | Loan Amount |
|---|---|---|---|
| Open | Bump Peter Timothy | $47,250 |
Source: Public Records
Tax History
| Year | Tax Paid | Tax Assessment Tax Assessment Total Assessment is a certain percentage of the fair market value that is determined by local assessors to be the total taxable value of land and additions on the property. | Land | Improvement |
|---|---|---|---|---|
| 2025 | $3,135 | $311,674 | $161,884 | $149,790 |
| 2024 | $3,135 | $305,563 | $158,710 | $146,853 |
| 2023 | $3,060 | $299,572 | $155,598 | $143,974 |
| 2022 | $3,004 | $293,699 | $152,548 | $141,151 |
| 2021 | $2,943 | $287,941 | $149,557 | $138,384 |
| 2020 | $2,916 | $284,989 | $148,023 | $136,966 |
| 2019 | $2,856 | $279,401 | $145,120 | $134,281 |
| 2018 | $2,802 | $273,923 | $142,274 | $131,649 |
| 2017 | $2,744 | $268,552 | $139,484 | $129,068 |
| 2016 | $2,698 | $263,287 | $136,749 | $126,538 |
| 2015 | $2,664 | $259,333 | $134,695 | $124,638 |
| 2014 | $2,605 | $254,254 | $132,057 | $122,197 |
Source: Public Records
Map
Nearby Homes
- 24342 Cardinal Place
- 21961 Cayuga Ln
- 24596 Donna Ln
- 21922 Erie Ln
- 24231 Sparrow St
- 21886 Winnebago Ln
- 24662 Toledo Ln
- 24192 Angela St
- 22482 Lake Forest Ln
- 24001 Muirlands Blvd Unit 31
- 24001 Muirlands Blvd Unit 12
- 24001 Muirlands Blvd Unit 352
- 24001 Muirlands Blvd Unit 315
- 24001 Muirlands Blvd Unit 138
- 24001 Muirlands Blvd Unit 326
- 24001 Muirlands Blvd Unit 11
- 24001 Muirlands Blvd Unit 186
- 24001 Muirlands Blvd Unit 34
- 24001 Muirlands Blvd Unit 64
- 24001 Muirlands Blvd Unit 115
- 24455 Peacock St
- 24441 Peacock St
- 24446 Peacock St
- 24452 Peacock St
- 24442 Peacock St
- 24456 Peacock St
- 24431 Peacock St
- 24432 Peacock St
- 24471 Peacock St
- 24462 Peacock St
- 24425 Peacock St
- 24426 Peacock St
- 24495 Jeronimo Ln
- 24491 Jeronimo Ln
- 24485 Jeronimo Ln
- 24499 Jeronimo Ln
- 22155 Crane St
- 24481 Jeronimo Ln
- 24411 Mockingbird Place
- 24501 Jeronimo Ln
Your Personal Tour Guide
Ask me questions while you tour the home.