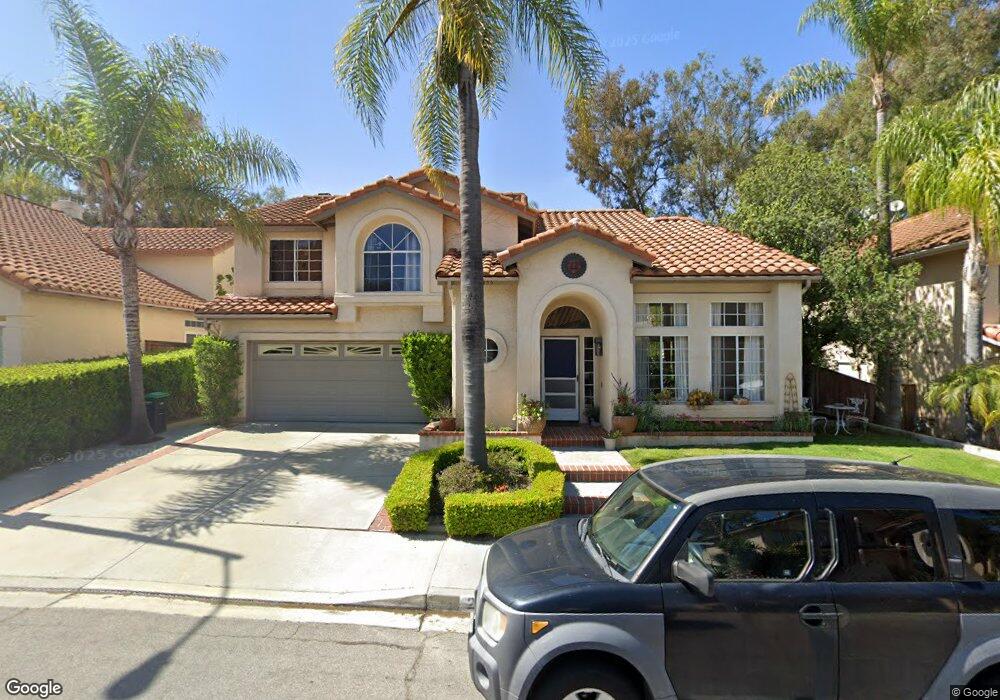
24455 Kings View Laguna Niguel, CA 92677
Estimated Value: $1,453,573 - $1,524,000
3
Beds
3
Baths
2,074
Sq Ft
$717/Sq Ft
Est. Value
About This Home
This home is located at 24455 Kings View, Laguna Niguel, CA 92677 and is currently estimated at $1,486,643, approximately $716 per square foot. 24455 Kings View is a home located in Orange County with nearby schools including Moulton Elementary, Aliso Viejo Middle School, and Aliso Niguel High School.
Ownership History
Date
Name
Owned For
Owner Type
Purchase Details
Closed on
Feb 11, 2016
Sold by
Knight Geoffrey W and Knight Heidi P
Bought by
The Knight 2016 Family Trust
Current Estimated Value
Purchase Details
Closed on
Dec 14, 2001
Sold by
Ostergar Allen C and Ostergar Catherine S
Bought by
Knight Geoffrey W and Knight Heidi P
Home Financials for this Owner
Home Financials are based on the most recent Mortgage that was taken out on this home.
Original Mortgage
$300,700
Interest Rate
5.5%
Mortgage Type
Purchase Money Mortgage
Purchase Details
Closed on
Mar 30, 1998
Sold by
Ostergar Allen C and Ostergar Cathy S
Bought by
Ostergar Allen C and Ostergar Catherine S
Purchase Details
Closed on
Aug 23, 1993
Sold by
Mclaughlin Leslie N and Mclaughlin Judith M
Bought by
Ostergar Allen C and Ostergar Cathy S
Home Financials for this Owner
Home Financials are based on the most recent Mortgage that was taken out on this home.
Original Mortgage
$173,600
Interest Rate
6.88%
Create a Home Valuation Report for This Property
The Home Valuation Report is an in-depth analysis detailing your home's value as well as a comparison with similar homes in the area
Home Values in the Area
Average Home Value in this Area
Purchase History
| Date | Buyer | Sale Price | Title Company |
|---|---|---|---|
| The Knight 2016 Family Trust | -- | None Available | |
| Knight Geoffrey W | $397,000 | Old Republic Title Company | |
| Ostergar Allen C | -- | -- | |
| Ostergar Allen C | $217,000 | Chicago Title Company |
Source: Public Records
Mortgage History
| Date | Status | Borrower | Loan Amount |
|---|---|---|---|
| Previous Owner | Knight Geoffrey W | $300,700 | |
| Previous Owner | Ostergar Allen C | $173,600 |
Source: Public Records
Tax History Compared to Growth
Tax History
| Year | Tax Paid | Tax Assessment Tax Assessment Total Assessment is a certain percentage of the fair market value that is determined by local assessors to be the total taxable value of land and additions on the property. | Land | Improvement |
|---|---|---|---|---|
| 2025 | $5,766 | $586,480 | $348,251 | $238,229 |
| 2024 | $5,766 | $574,981 | $341,423 | $233,558 |
| 2023 | $5,642 | $563,707 | $334,728 | $228,979 |
| 2022 | $5,534 | $552,654 | $328,164 | $224,490 |
| 2021 | $5,425 | $541,818 | $321,729 | $220,089 |
| 2020 | $5,371 | $536,263 | $318,430 | $217,833 |
| 2019 | $5,264 | $525,749 | $312,187 | $213,562 |
| 2018 | $5,162 | $515,441 | $306,066 | $209,375 |
| 2017 | $5,059 | $505,335 | $300,065 | $205,270 |
| 2016 | $4,961 | $495,427 | $294,181 | $201,246 |
| 2015 | $4,885 | $487,986 | $289,762 | $198,224 |
| 2014 | $4,790 | $478,428 | $284,086 | $194,342 |
Source: Public Records
Map
Nearby Homes
- 1 O'Hill
- 24615 Kings Rd
- 24705 Queens Ct
- 24625 Los Serranos Dr
- 29181 Via San Sebastian
- 24561 Los Serranos Dr
- 29162 Bobolink Dr
- 29141 Bobolink Dr
- 24877 Nueva Vista Dr Unit 23
- 24839 Nueva Vista Dr Unit 5
- 24822 Cutter
- 30042 Oceanus
- 25111 Adelanto Dr
- 24471 Los Serranos Dr
- 29606 Sea Horse Cove
- 25112 Armagosa Dr
- 23971 Stillwater Ln
- 28793 El Adolfo
- 25085 Sanoria St
- 24235 Via Aquara Ave
- 24461 Kings View
- 24451 Kings View
- 29452 Crown Ridge
- 29442 Crown Ridge
- 29456 Crown Ridge
- 24441 Kings View
- 24471 Kings View
- 29432 Crown Ridge
- 29462 Crown Ridge
- 24452 Kings View
- 24456 Kings View
- 29426 Crown Ridge
- 24442 Kings View
- 24431 Kings View
- 24475 Kings View
- 29472 Crown Ridge
- 24432 Kings View
- 24462 Kings View
- 29422 Crown Ridge
- 24421 Kings View