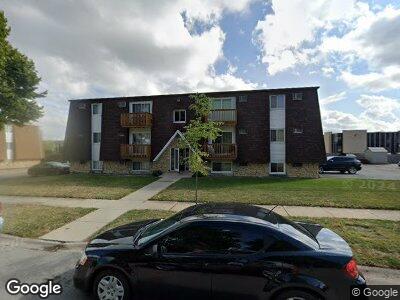
2446 Walsh Way Unit 2D Joliet, IL 60435
Estimated Value: $70,000 - $95,000
2
Beds
1
Bath
667
Sq Ft
$123/Sq Ft
Est. Value
About This Home
This home is located at 2446 Walsh Way Unit 2D, Joliet, IL 60435 and is currently estimated at $82,171, approximately $123 per square foot. 2446 Walsh Way Unit 2D is a home located in Will County with nearby schools including Thomas Jefferson Elementary School, Hufford Junior High School, and Joliet West High School.
Ownership History
Date
Name
Owned For
Owner Type
Purchase Details
Closed on
Feb 7, 2014
Sold by
Deutsche Bank Trust Company Americas
Bought by
Andel John
Current Estimated Value
Purchase Details
Closed on
Jun 17, 2013
Sold by
Edwards Linda A and Edwards Linda
Bought by
Deutsche Bank Trust Company Americas and Rali 2006 Qs12
Purchase Details
Closed on
Mar 6, 2013
Sold by
Edwards Linda A and Edwards Linda
Bought by
Pnc Bank Na
Purchase Details
Closed on
May 19, 2006
Sold by
Kristofer George L and Kristofer Priscilla A
Bought by
Edwards Linda A
Home Financials for this Owner
Home Financials are based on the most recent Mortgage that was taken out on this home.
Original Mortgage
$95,000
Interest Rate
6.59%
Mortgage Type
Purchase Money Mortgage
Purchase Details
Closed on
Mar 21, 2003
Sold by
Jackinowski Raymond L
Bought by
Franzen Christopher C
Create a Home Valuation Report for This Property
The Home Valuation Report is an in-depth analysis detailing your home's value as well as a comparison with similar homes in the area
Home Values in the Area
Average Home Value in this Area
Purchase History
| Date | Buyer | Sale Price | Title Company |
|---|---|---|---|
| Andel John | $37,919 | None Available | |
| Deutsche Bank Trust Company Americas | $139,731 | None Available | |
| Pnc Bank Na | $139,731 | None Available | |
| Edwards Linda A | $100,000 | None Available | |
| Franzen Christopher C | $55,000 | First American |
Source: Public Records
Mortgage History
| Date | Status | Borrower | Loan Amount |
|---|---|---|---|
| Closed | Andel John | $640,000 | |
| Previous Owner | Edwards Linda A | $95,000 |
Source: Public Records
Tax History Compared to Growth
Tax History
| Year | Tax Paid | Tax Assessment Tax Assessment Total Assessment is a certain percentage of the fair market value that is determined by local assessors to be the total taxable value of land and additions on the property. | Land | Improvement |
|---|---|---|---|---|
| 2023 | $1,953 | $21,230 | $3,115 | $18,115 |
| 2022 | $1,828 | $20,089 | $2,948 | $17,141 |
| 2021 | $1,417 | $18,898 | $2,773 | $16,125 |
| 2020 | $1,748 | $18,898 | $2,773 | $16,125 |
| 2019 | $1,715 | $18,128 | $2,660 | $15,468 |
| 2018 | $1,572 | $16,085 | $2,660 | $13,425 |
| 2017 | $1,629 | $16,085 | $2,660 | $13,425 |
| 2016 | $1,624 | $15,434 | $2,660 | $12,774 |
| 2015 | $1,870 | $15,434 | $2,660 | $12,774 |
| 2014 | $1,870 | $15,333 | $2,660 | $12,673 |
| 2013 | $1,870 | $24,320 | $2,660 | $21,660 |
Source: Public Records
Map
Nearby Homes
- 423 Tana Ln
- 2234 W Acres Rd
- 2617 Caddy Ln
- 654 Springfield Ave
- 122 Inwood Dr
- 402 N 129th Infantry Dr
- 802 Sheila Dr
- 122 Fairlane Dr
- 2818 Warren Dorris Dr
- 712 Fairlane Dr
- 214 Madison St Unit 2C
- 216 Madison St Unit 1A
- 2365 W Jefferson St
- 222 Madison St Unit 302
- 222 Madison St Unit 315
- 222 Madison St Unit 403
- 222 Madison St Unit 207
- 930 Sheila Dr
- 729 Barber Ln
- 2608 George Ave Unit 69
- 2446 Walsh Way Unit 1C
- 2446 Walsh Way Unit 1B
- 2446 Walsh Way Unit 3A
- 2446 Walsh Way Unit 3B
- 2446 Walsh Way Unit 2B
- 2446 Walsh Way Unit 101B
- 2446 Walsh Way Unit 2D
- 2446 Walsh Way Unit 304B
- 2446 Walsh Way Unit 2C
- 2446 Walsh Way Unit 2A
- 2446 Walsh Way Unit 3C
- 2446 Walsh Way Unit 104B
- 2446 Walsh Way Unit 102B
- 2446 Walsh Way Unit 3D
- 2446 Walsh Way Unit 103B
- 2446 Walsh Way Unit 1A
- 417 Bethel Dr Unit 2S
- 2456 Walsh Way Unit 104A
- 2456 Walsh Way Unit 1D
- 2456 Walsh Way Unit 3C