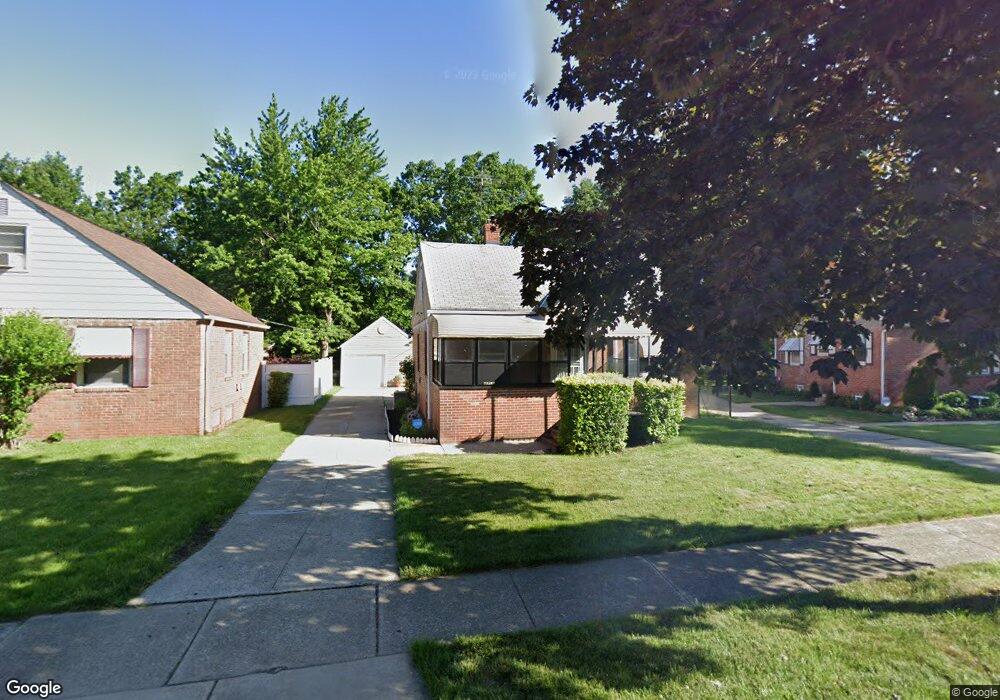
24461 Mavec Ave Euclid, OH 44123
Estimated Value: $108,000 - $161,000
2
Beds
1
Bath
761
Sq Ft
$173/Sq Ft
Est. Value
About This Home
This home is located at 24461 Mavec Ave, Euclid, OH 44123 and is currently estimated at $131,844, approximately $173 per square foot. 24461 Mavec Ave is a home located in Cuyahoga County with nearby schools including Bluestone Elementary School, Euclid High School, and Pinnacle Academy.
Ownership History
Date
Name
Owned For
Owner Type
Purchase Details
Closed on
May 9, 2001
Sold by
Collins Wanda I and Collins Willie F
Bought by
Collins Ernest and Collins Wanda I
Current Estimated Value
Home Financials for this Owner
Home Financials are based on the most recent Mortgage that was taken out on this home.
Original Mortgage
$80,000
Outstanding Balance
$35,800
Interest Rate
9.75%
Estimated Equity
$96,044
Purchase Details
Closed on
Aug 7, 1996
Sold by
Schervish Mark W
Bought by
Al Wanda L Collins
Home Financials for this Owner
Home Financials are based on the most recent Mortgage that was taken out on this home.
Original Mortgage
$72,853
Interest Rate
8.33%
Mortgage Type
FHA
Purchase Details
Closed on
Apr 18, 1988
Sold by
Petty William C
Bought by
Schervish Mark W
Purchase Details
Closed on
Sep 19, 1983
Sold by
Campbell Edward W
Bought by
Petty William C
Purchase Details
Closed on
Feb 20, 1980
Sold by
Bittrich Amy
Bought by
Campbell Edward W
Purchase Details
Closed on
Jan 1, 1975
Bought by
Bittrich Amy
Create a Home Valuation Report for This Property
The Home Valuation Report is an in-depth analysis detailing your home's value as well as a comparison with similar homes in the area
Home Values in the Area
Average Home Value in this Area
Purchase History
| Date | Buyer | Sale Price | Title Company |
|---|---|---|---|
| Collins Ernest | -- | -- | |
| Al Wanda L Collins | $72,900 | -- | |
| Schervish Mark W | $48,500 | -- | |
| Petty William C | $44,000 | -- | |
| Campbell Edward W | $37,500 | -- | |
| Bittrich Amy | -- | -- |
Source: Public Records
Mortgage History
| Date | Status | Borrower | Loan Amount |
|---|---|---|---|
| Open | Collins Ernest | $80,000 | |
| Closed | Al Wanda L Collins | $72,853 |
Source: Public Records
Tax History Compared to Growth
Tax History
| Year | Tax Paid | Tax Assessment Tax Assessment Total Assessment is a certain percentage of the fair market value that is determined by local assessors to be the total taxable value of land and additions on the property. | Land | Improvement |
|---|---|---|---|---|
| 2024 | $2,782 | $40,110 | $8,505 | $31,605 |
| 2023 | $2,566 | $29,480 | $6,410 | $23,070 |
| 2022 | $2,508 | $29,470 | $6,410 | $23,070 |
| 2021 | $2,792 | $29,470 | $6,410 | $23,070 |
| 2020 | $2,648 | $25,410 | $5,530 | $19,880 |
| 2019 | $2,379 | $72,600 | $15,800 | $56,800 |
| 2018 | $2,312 | $25,200 | $5,530 | $19,670 |
| 2017 | $2,546 | $22,510 | $4,590 | $17,920 |
| 2016 | $2,551 | $22,510 | $4,590 | $17,920 |
| 2015 | $2,323 | $22,510 | $4,590 | $17,920 |
| 2014 | $2,323 | $22,510 | $4,590 | $17,920 |
Source: Public Records
Map
Nearby Homes
- 860 E 245th St
- 23901 Colbourne Rd
- 24330 Glenforest Rd
- 833 E 250th St
- 820 E 250th St
- 23880 Hartland Dr
- 23050 Tracy Ave
- 23896 Devoe Ave
- 24451 Devoe Ave
- 861 E 256th St
- 25550 Tungsten Rd
- 825 E 256th St
- 720 E 254th St
- 1507 E 256th St
- 754 E 256th St
- 22751 Fox Ave
- 490 Kenwood Dr Unit B
- 22301 Milton Dr
- 515 E 222nd St
- 422 Clearview Dr Unit J10
- 24451 Mavec Ave
- 24471 Mavec Ave
- 24441 Mavec Ave
- 24481 Mavec Ave
- 24431 Mavec Ave
- 24460 Mavec Ave
- 24470 Mavec Ave
- 24450 Mavec Ave
- 924 E 245th St
- 24421 Mavec Ave
- 920 E 245th St
- 24440 Mavec Ave
- 910 E 245th St
- 940 E 245th St
- 24430 Mavec Ave
- 900 E 245th St
- 944 E 245th St
- 24411 Mavec Ave
- 24420 Mavec Ave
- 800 E 245th St