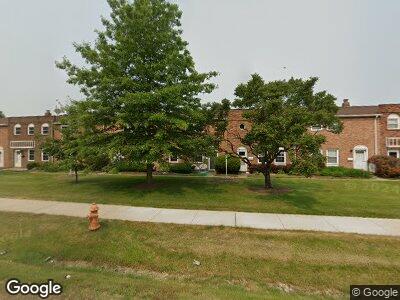
24466 Clareshire Dr Unit 10A North Olmsted, OH 44070
Estimated Value: $142,000 - $172,000
3
Beds
2
Baths
1,408
Sq Ft
$112/Sq Ft
Est. Value
About This Home
This home is located at 24466 Clareshire Dr Unit 10A, North Olmsted, OH 44070 and is currently estimated at $157,345, approximately $111 per square foot. 24466 Clareshire Dr Unit 10A is a home located in Cuyahoga County with nearby schools including Maple Intermediate Elementary School, Pine Intermediate School, and North Olmsted Middle School.
Ownership History
Date
Name
Owned For
Owner Type
Purchase Details
Closed on
May 24, 1999
Sold by
Basso David M and Basso Megan L
Bought by
Cadiz Carandang Manuel T and Cadiz Carandang Carolina A
Current Estimated Value
Home Financials for this Owner
Home Financials are based on the most recent Mortgage that was taken out on this home.
Original Mortgage
$51,000
Interest Rate
6.92%
Purchase Details
Closed on
Nov 12, 1997
Sold by
Henry L Goyetche Est
Bought by
Basso David M and Basso Megan L
Home Financials for this Owner
Home Financials are based on the most recent Mortgage that was taken out on this home.
Original Mortgage
$48,000
Interest Rate
7.43%
Mortgage Type
New Conventional
Purchase Details
Closed on
Jan 6, 1978
Sold by
Raymond E Olexen
Bought by
Goyetche Henry L
Purchase Details
Closed on
Jan 1, 1975
Bought by
Olexen Raymond E
Create a Home Valuation Report for This Property
The Home Valuation Report is an in-depth analysis detailing your home's value as well as a comparison with similar homes in the area
Home Values in the Area
Average Home Value in this Area
Purchase History
| Date | Buyer | Sale Price | Title Company |
|---|---|---|---|
| Cadiz Carandang Manuel T | $91,000 | Midland Title Security Inc | |
| Basso David M | $83,000 | -- | |
| Goyetche Henry L | $35,000 | -- | |
| Raymond E Olexen | -- | -- | |
| Olexen Raymond E | -- | -- |
Source: Public Records
Mortgage History
| Date | Status | Borrower | Loan Amount |
|---|---|---|---|
| Open | Carandang Manuel T | $67,000 | |
| Closed | Carandang Manuel T | $51,200 | |
| Closed | Cadiz Carandang Manuel T | $51,000 | |
| Closed | Basso David M | $48,000 |
Source: Public Records
Tax History Compared to Growth
Tax History
| Year | Tax Paid | Tax Assessment Tax Assessment Total Assessment is a certain percentage of the fair market value that is determined by local assessors to be the total taxable value of land and additions on the property. | Land | Improvement |
|---|---|---|---|---|
| 2024 | $2,207 | $42,000 | $4,620 | $37,380 |
| 2023 | $1,842 | $31,720 | $3,190 | $28,530 |
| 2022 | $1,866 | $31,710 | $3,190 | $28,530 |
| 2021 | $1,689 | $27,830 | $2,800 | $25,030 |
| 2020 | $1,584 | $27,830 | $2,800 | $25,030 |
| 2019 | $1,541 | $79,500 | $8,000 | $71,500 |
| 2018 | $1,494 | $27,830 | $2,800 | $25,030 |
| 2017 | $1,449 | $25,030 | $2,490 | $22,540 |
| 2016 | $1,436 | $25,030 | $2,490 | $22,540 |
| 2015 | $1,776 | $25,030 | $2,490 | $22,540 |
| 2014 | $1,776 | $28,770 | $2,870 | $25,900 |
Source: Public Records
Map
Nearby Homes
- 24232 Moonlight Dr
- 4980 Greenflower St
- 24326 Mastick Rd
- 24930 Mitchell Dr
- 0 Mastick Rd Unit 5112571
- 24836 Kennedy Ridge Rd
- 4849 Grace Rd Unit 111
- 23810 Oak Ln
- 25735 Lorain Rd Unit 222
- 25735 Lorain Rd Unit 218
- 4429 Michael Ave
- 23855 David Dr Unit 115
- 23855 David Dr Unit 105
- 23865 David Dr Unit 204
- 23845 David Dr Unit 104
- 5708 Lewis Rd
- 24341 Gessner Rd
- 3920 Brendan Ln Unit H612
- 5890 Ruple Pkwy
- 4070 Fielding Dr
- 24466 Clareshire Dr Unit 10E
- 24466 Clareshire Dr Unit 10I
- 24466 Clareshire Dr Unit 10B
- 24466 Clareshire Dr Unit 10A
- 24466 Clareshire Dr Unit 10J
- 24466 Clareshire Dr Unit 10K
- 24466 Clareshire Dr Unit 10
- 24466 Clareshire Dr
- 24466 Clareshire Dr
- 24466 Clareshire Dr Unit 10D
- 24466 Clareshire Dr Unit C
- 24466 Clareshire Dr Unit 1
- 24496 Clareshire Dr Unit 9E
- 24496 Clareshire Dr Unit 9F
- 24496 Clareshire Dr Unit 9D
- 24496 Clareshire Dr Unit 9G
- 24496 Clareshire Dr
- 24496 Clareshire Dr
- 24496 Clareshire Dr Unit 9B
- 24496 Clareshire Dr Unit 9A