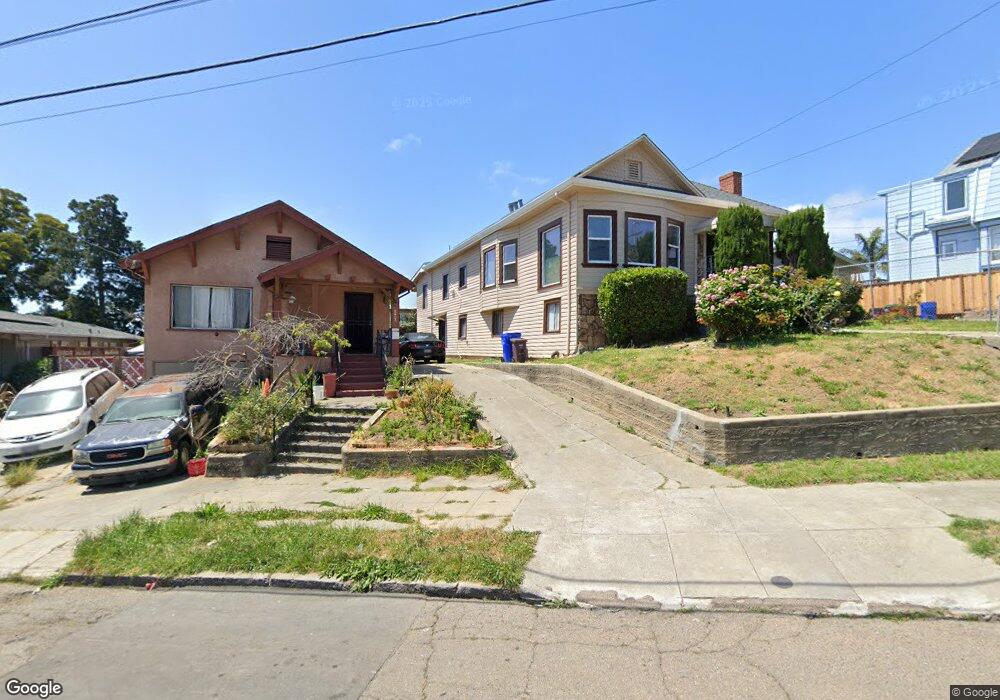
2447 E 23rd St Oakland, CA 94601
Meadow Brook NeighborhoodEstimated Value: $555,000 - $679,000
3
Beds
2
Baths
1,870
Sq Ft
$326/Sq Ft
Est. Value
About This Home
This home is located at 2447 E 23rd St, Oakland, CA 94601 and is currently estimated at $610,294, approximately $326 per square foot. 2447 E 23rd St is a home located in Alameda County with nearby schools including Manzanita Community School, Manzanita Seed Elementary School, and Roosevelt Middle School.
Ownership History
Date
Name
Owned For
Owner Type
Purchase Details
Closed on
Feb 23, 2025
Sold by
Lampkin Cynthia A and Allen Cynthia Michelle
Bought by
Allen Cynthia Michelle
Current Estimated Value
Home Financials for this Owner
Home Financials are based on the most recent Mortgage that was taken out on this home.
Original Mortgage
$60,000
Outstanding Balance
$59,602
Interest Rate
7.04%
Mortgage Type
New Conventional
Estimated Equity
$550,692
Purchase Details
Closed on
Mar 17, 2017
Sold by
Lampkin Cynthia A and Allen Cynthia
Bought by
Lampkin Cynthia A
Home Financials for this Owner
Home Financials are based on the most recent Mortgage that was taken out on this home.
Original Mortgage
$296,041
Interest Rate
4.5%
Mortgage Type
FHA
Purchase Details
Closed on
Aug 7, 2013
Sold by
Allen James Woodrow and Allen Julia B
Bought by
Allen James Woodrow and Allen Julia B
Create a Home Valuation Report for This Property
The Home Valuation Report is an in-depth analysis detailing your home's value as well as a comparison with similar homes in the area
Home Values in the Area
Average Home Value in this Area
Purchase History
| Date | Buyer | Sale Price | Title Company |
|---|---|---|---|
| Allen Cynthia Michelle | -- | None Listed On Document | |
| Lampkin Cynthia A | -- | Usa National Title Inc | |
| Allen James Woodrow | -- | None Available |
Source: Public Records
Mortgage History
| Date | Status | Borrower | Loan Amount |
|---|---|---|---|
| Open | Allen Cynthia Michelle | $60,000 | |
| Previous Owner | Lampkin Cynthia A | $296,041 |
Source: Public Records
Tax History
| Year | Tax Paid | Tax Assessment Tax Assessment Total Assessment is a certain percentage of the fair market value that is determined by local assessors to be the total taxable value of land and additions on the property. | Land | Improvement |
|---|---|---|---|---|
| 2025 | $2,455 | $42,525 | $25,008 | $24,517 |
| 2024 | $2,455 | $41,554 | $24,517 | $24,037 |
| 2023 | $2,431 | $47,602 | $24,037 | $23,565 |
| 2022 | $2,284 | $39,668 | $23,565 | $23,103 |
| 2021 | $2,016 | $38,753 | $23,103 | $22,650 |
| 2020 | $1,989 | $45,285 | $22,867 | $22,418 |
| 2019 | $1,808 | $44,397 | $22,418 | $21,979 |
| 2018 | $1,769 | $43,527 | $21,979 | $21,548 |
| 2017 | $1,661 | $42,673 | $21,548 | $21,125 |
| 2016 | $1,504 | $41,836 | $21,125 | $20,711 |
| 2015 | $1,487 | $41,208 | $20,808 | $20,400 |
| 2014 | $1,326 | $40,400 | $20,400 | $20,000 |
Source: Public Records
Map
Nearby Homes
- 2222 Inyo Ave
- 2510 E 21st St
- 2409 25th Ave
- 2443 Grande Vista Ave
- 2724 E 22nd St
- 2304 E 22nd St
- 2322 E 21st St
- 2628 Logan St
- 2017 27th Ave
- 2618 E 20th St
- 2217 E 24th St
- 2021 Mitchell St
- 2004 27th Ave
- 2216 E 23rd St
- 2912 E 22nd St
- 2607 23rd Ave
- 2207 E 21st St
- 2134 E 21st St
- 2120 E 22nd St
- 2918 Foothill Blvd
Your Personal Tour Guide
Ask me questions while you tour the home.