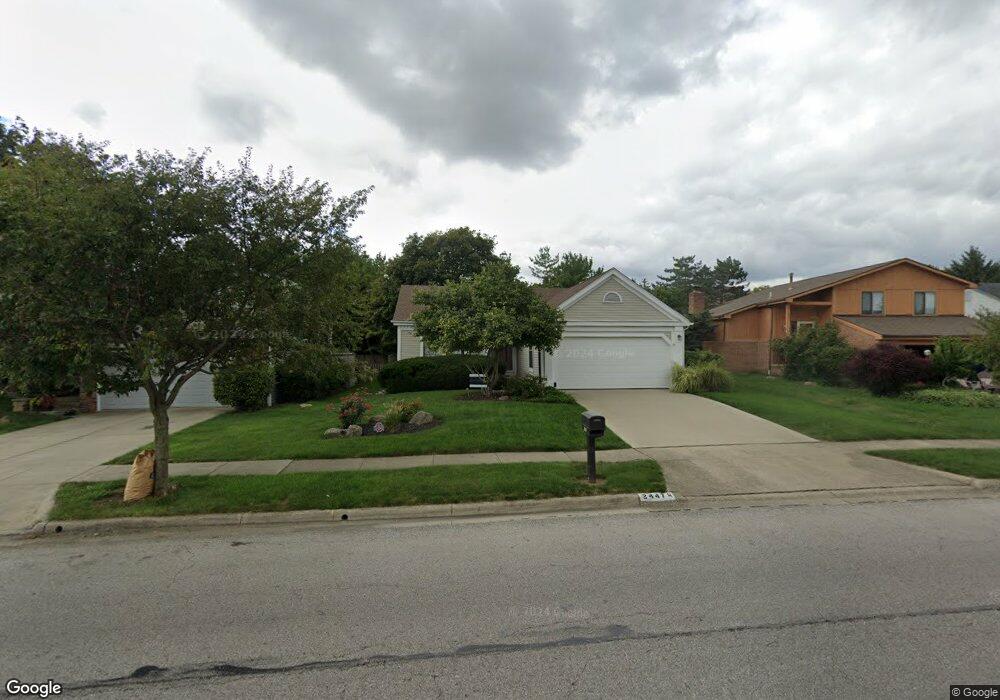
2447 Sutter Pkwy Dublin, OH 43016
Olde Sawmill NeighborhoodEstimated Value: $321,412 - $371,000
3
Beds
2
Baths
1,134
Sq Ft
$311/Sq Ft
Est. Value
About This Home
This home is located at 2447 Sutter Pkwy, Dublin, OH 43016 and is currently estimated at $352,603, approximately $310 per square foot. 2447 Sutter Pkwy is a home located in Franklin County with nearby schools including Olde Sawmill Elementary School, Ann Simpson Davis Middle School, and Dublin Scioto High School.
Ownership History
Date
Name
Owned For
Owner Type
Purchase Details
Closed on
Dec 17, 2007
Sold by
Samms Todd K and Samms Kristy M
Bought by
Williamson Beverly L
Current Estimated Value
Home Financials for this Owner
Home Financials are based on the most recent Mortgage that was taken out on this home.
Original Mortgage
$80,000
Outstanding Balance
$49,633
Interest Rate
6.27%
Mortgage Type
Purchase Money Mortgage
Estimated Equity
$302,970
Purchase Details
Closed on
Jun 26, 2001
Sold by
Brand Pierre and Brand Michelle L
Bought by
Samms Todd K and Samms Kristy M
Home Financials for this Owner
Home Financials are based on the most recent Mortgage that was taken out on this home.
Original Mortgage
$138,900
Interest Rate
7.27%
Mortgage Type
FHA
Purchase Details
Closed on
Apr 4, 1994
Bought by
Brand Pierre and Brand Michelle L
Purchase Details
Closed on
Nov 25, 1992
Purchase Details
Closed on
Feb 13, 1990
Create a Home Valuation Report for This Property
The Home Valuation Report is an in-depth analysis detailing your home's value as well as a comparison with similar homes in the area
Home Values in the Area
Average Home Value in this Area
Purchase History
| Date | Buyer | Sale Price | Title Company |
|---|---|---|---|
| Williamson Beverly L | $165,000 | Title First | |
| Samms Todd K | $140,000 | -- | |
| Brand Pierre | $97,000 | -- | |
| -- | $92,000 | -- | |
| -- | $83,200 | -- |
Source: Public Records
Mortgage History
| Date | Status | Borrower | Loan Amount |
|---|---|---|---|
| Open | Williamson Beverly L | $80,000 | |
| Previous Owner | Samms Todd K | $138,900 |
Source: Public Records
Tax History
| Year | Tax Paid | Tax Assessment Tax Assessment Total Assessment is a certain percentage of the fair market value that is determined by local assessors to be the total taxable value of land and additions on the property. | Land | Improvement |
|---|---|---|---|---|
| 2025 | $4,664 | $86,910 | $36,750 | $50,160 |
| 2024 | $4,664 | $86,910 | $36,750 | $50,160 |
| 2023 | $4,636 | $86,910 | $36,750 | $50,160 |
| 2022 | $3,582 | $64,580 | $17,850 | $46,730 |
| 2021 | $3,641 | $64,580 | $17,850 | $46,730 |
| 2020 | $3,619 | $64,580 | $17,850 | $46,730 |
| 2019 | $3,270 | $53,420 | $14,880 | $38,540 |
| 2018 | $3,226 | $53,420 | $14,880 | $38,540 |
| 2017 | $3,019 | $53,420 | $14,880 | $38,540 |
| 2016 | $3,154 | $52,580 | $16,070 | $36,510 |
| 2015 | $3,172 | $52,580 | $16,070 | $36,510 |
| 2014 | $3,177 | $52,580 | $16,070 | $36,510 |
| 2013 | $1,613 | $52,570 | $16,065 | $36,505 |
Source: Public Records
Map
Nearby Homes
- 2621 Summer Dr
- 7480 Gardenview Place
- 2469 Sandstrom Dr
- 7912 Meadowhaven Blvd Unit 30
- 7887 Thornfield Ln Unit 50
- 7891 Thornfield Ln Unit 48
- 7641 Old Foxe Ct
- 2425 Sanford Dr
- 2744 Saltergate Dr
- 7853 Meadowhaven Blvd Unit 63
- 7847 Meadowhaven Blvd Unit 66
- 7755 Tripoli Ct
- 7685 Starmont Ct
- 7735 Schoolway Ct
- 3827 Carberry Dr Unit 3827
- 2074 Hard Rd
- 7844 Adare Ct Unit 5
- 7187 Inverness Ct Unit 7187
- 2514 Tevis Ann Ct
- 2026 Sawbury Blvd
- 2443 Sutter Pkwy
- 2451 Sutter Pkwy
- 2439 Sutter Pkwy
- 2455 Sutter Pkwy
- 2435 Sutter Pkwy
- 2431 Sutter Pkwy
- 2465 Sutter Pkwy
- 2427 Sutter Pkwy
- 2469 Sutter Pkwy
- 2419 Sutter Pkwy
- 2473 Sutter Pkwy
- 2473 Sutter Pkwy Unit OLDE SAWMILL
- 2415 Sutter Pkwy
- 2477 Sutter Pkwy
- 2411 Sutter Pkwy
- 2481 Sutter Pkwy
- 2555 Summer Dr
- 2555 Summer Dr
- 2407 Sutter Pkwy
- 2485 Sutter Pkwy
Your Personal Tour Guide
Ask me questions while you tour the home.