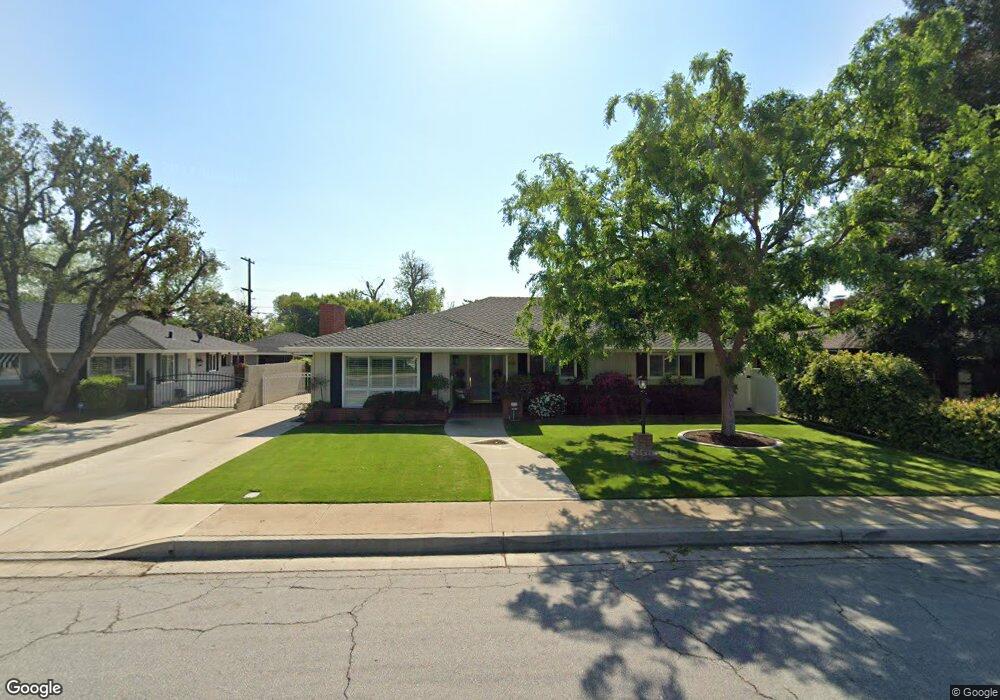
2448 Beech St Bakersfield, CA 93301
Riviera/Westchester NeighborhoodEstimated Value: $418,000 - $450,000
3
Beds
2
Baths
2,292
Sq Ft
$188/Sq Ft
Est. Value
About This Home
This home is located at 2448 Beech St, Bakersfield, CA 93301 and is currently estimated at $431,830, approximately $188 per square foot. 2448 Beech St is a home located in Kern County with nearby schools including Franklin Elementary School, Emerson Middle School, and Bakersfield High School.
Ownership History
Date
Name
Owned For
Owner Type
Purchase Details
Closed on
Nov 22, 2011
Sold by
Newman Sally
Bought by
Newman Sally P and Sally P Newman Living Trust
Current Estimated Value
Purchase Details
Closed on
Mar 9, 2011
Sold by
Dispoto Patsy and Patsy Dispoto Revocable Trust
Bought by
Newman Sally
Purchase Details
Closed on
Dec 8, 2000
Sold by
Dispoto Patsy
Bought by
Dispoto Patsy and Patsy Dispoto Revocable Trust
Purchase Details
Closed on
Dec 23, 1997
Sold by
Dispoto Bruno and Dispoto Patsy
Bought by
Dispoto Bruno and Dispoto Patsy
Create a Home Valuation Report for This Property
The Home Valuation Report is an in-depth analysis detailing your home's value as well as a comparison with similar homes in the area
Home Values in the Area
Average Home Value in this Area
Purchase History
| Date | Buyer | Sale Price | Title Company |
|---|---|---|---|
| Newman Sally P | -- | None Available | |
| Newman Sally | $240,000 | Ticor Title Company Of Ca | |
| Dispoto Patsy | -- | -- | |
| Dispoto Bruno | -- | -- |
Source: Public Records
Tax History
| Year | Tax Paid | Tax Assessment Tax Assessment Total Assessment is a certain percentage of the fair market value that is determined by local assessors to be the total taxable value of land and additions on the property. | Land | Improvement |
|---|---|---|---|---|
| 2025 | $4,172 | $307,470 | $51,240 | $256,230 |
| 2024 | $4,087 | $301,442 | $50,236 | $251,206 |
| 2023 | $4,087 | $295,532 | $49,251 | $246,281 |
| 2022 | $4,002 | $289,738 | $48,286 | $241,452 |
| 2021 | $3,876 | $284,058 | $47,340 | $236,718 |
| 2020 | $3,835 | $281,146 | $46,855 | $234,291 |
| 2019 | $3,758 | $281,146 | $46,855 | $234,291 |
| 2018 | $3,667 | $270,232 | $45,037 | $225,195 |
| 2017 | $3,648 | $264,934 | $44,154 | $220,780 |
| 2016 | $3,322 | $259,740 | $43,289 | $216,451 |
| 2015 | $3,306 | $255,839 | $42,639 | $213,200 |
| 2014 | $3,197 | $250,828 | $41,804 | $209,024 |
Source: Public Records
Map
Nearby Homes
Your Personal Tour Guide
Ask me questions while you tour the home.