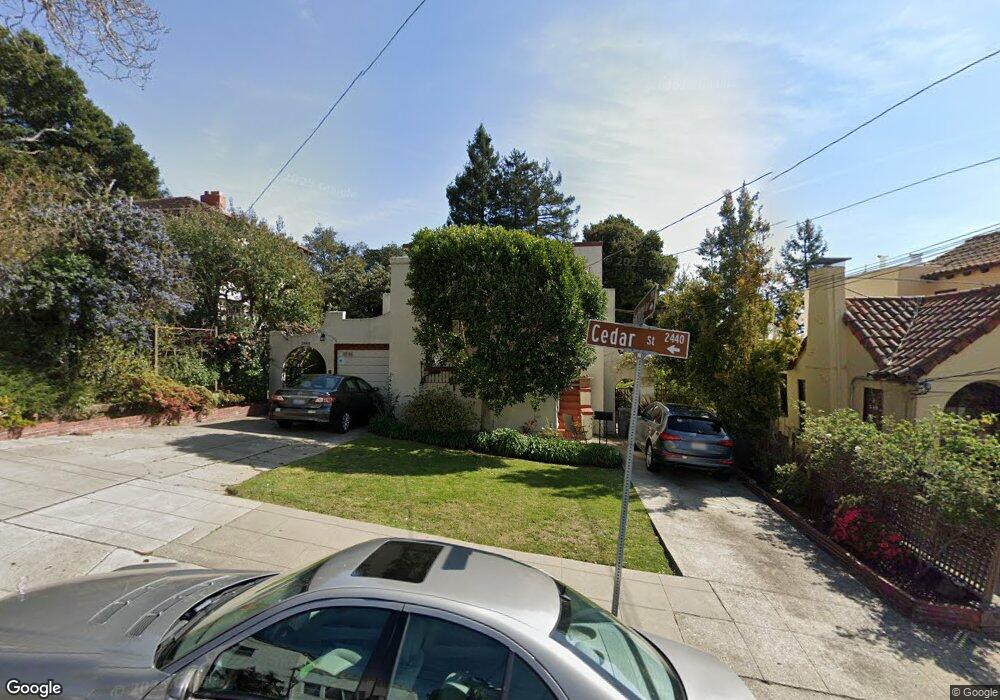
2448 Cedar St Berkeley, CA 94708
North Berkeley NeighborhoodEstimated Value: $1,454,000 - $2,523,000
4
Beds
3
Baths
3,087
Sq Ft
$693/Sq Ft
Est. Value
About This Home
This home is located at 2448 Cedar St, Berkeley, CA 94708 and is currently estimated at $2,140,384, approximately $693 per square foot. 2448 Cedar St is a home located in Alameda County with nearby schools including Berkeley Arts Magnet at Whittier School, Cragmont Elementary School, and Washington Elementary School.
Ownership History
Date
Name
Owned For
Owner Type
Purchase Details
Closed on
Jun 20, 2013
Sold by
Jurgenson Andrew A and Brannen Christalyn
Bought by
Jurgenson Andrew A and Brannen Christalyn
Current Estimated Value
Purchase Details
Closed on
Mar 20, 2003
Sold by
Daley Jeffrey B and Jeffrey H Daley Revocable Trus
Bought by
Jurgenson Andrew A and Brannen Christalyn
Home Financials for this Owner
Home Financials are based on the most recent Mortgage that was taken out on this home.
Original Mortgage
$500,000
Outstanding Balance
$213,536
Interest Rate
5.79%
Estimated Equity
$1,926,848
Purchase Details
Closed on
Feb 27, 1998
Sold by
Daley Jeffrey H
Bought by
Daley Jeffrey H and The Jeffrey H Daley Revocable
Purchase Details
Closed on
Apr 28, 1997
Sold by
Daley Jeffrey H and C David Swanson Trust
Bought by
Daley Jeffrey H
Purchase Details
Closed on
Feb 27, 1995
Sold by
Swanson C David
Bought by
Swanson C David
Create a Home Valuation Report for This Property
The Home Valuation Report is an in-depth analysis detailing your home's value as well as a comparison with similar homes in the area
Home Values in the Area
Average Home Value in this Area
Purchase History
| Date | Buyer | Sale Price | Title Company |
|---|---|---|---|
| Jurgenson Andrew A | -- | None Available | |
| Jurgenson Andrew A | $388,500 | Old Republic Title Company | |
| Daley Jeffrey H | -- | -- | |
| Daley Jeffrey H | -- | -- | |
| Swanson C David | -- | -- |
Source: Public Records
Mortgage History
| Date | Status | Borrower | Loan Amount |
|---|---|---|---|
| Open | Jurgenson Andrew A | $500,000 |
Source: Public Records
Tax History
| Year | Tax Paid | Tax Assessment Tax Assessment Total Assessment is a certain percentage of the fair market value that is determined by local assessors to be the total taxable value of land and additions on the property. | Land | Improvement |
|---|---|---|---|---|
| 2025 | $19,826 | $1,103,648 | $331,927 | $778,721 |
| 2024 | $19,826 | $1,081,875 | $325,420 | $763,455 |
| 2023 | $19,351 | $1,067,532 | $319,041 | $748,491 |
| 2022 | $19,418 | $1,039,603 | $312,786 | $733,817 |
| 2021 | $19,437 | $1,019,088 | $306,655 | $719,433 |
| 2020 | $18,354 | $1,015,573 | $303,513 | $712,060 |
| 2019 | $17,564 | $995,664 | $297,563 | $698,101 |
| 2018 | $17,208 | $976,146 | $291,730 | $684,416 |
| 2017 | $16,626 | $957,011 | $286,011 | $671,000 |
| 2016 | $16,006 | $938,253 | $280,405 | $657,848 |
| 2015 | $15,781 | $924,165 | $276,195 | $647,970 |
| 2014 | $16,002 | $906,066 | $270,786 | $635,280 |
Source: Public Records
Map
Nearby Homes
- 2421 Hilgard Ave
- 2477 Virginia St
- 1622 Scenic Ave
- 2451 Le Conte Ave
- 2340 Virginia St
- 2301 Virginia St Unit 1
- 2600 Hilgard Ave
- 2634 Virginia St Unit 33
- 1698 La Loma Ave Unit 1698
- 1739 Spruce St
- 2700 Le Conte Ave Unit 301
- 2700 Le Conte Ave Unit 402
- 2201 Virginia St Unit 2
- 1515 Oxford St Unit 1D
- 2501 Rose Walk
- 1682 Oxford St
- 1444 Walnut St
- 2035 Francisco St
- 2686 Shasta Rd
- 1408 Henry St
- 2440 Cedar St Unit 2
- 2442 Cedar St Unit 1
- 2454 Cedar St
- 2422 Cedar St
- 2470 Cedar St
- 2443 Hilgard Ave Unit 3
- 2443 Hilgard Ave Unit 4
- 2443 Hilgard Ave Unit 2
- 2443 Hilgard Ave Unit 1
- 2455 Hilgard Ave
- 1597 Hawthorne Terrace
- 2435 Hilgard Ave
- 2418 Cedar St
- 2427 Hilgard Ave
- 2459 Hilgard Ave
- 1598 Hawthorne Terrace
- 2461 Cedar St
- 2461 Hilgard Ave
- 1611 Scenic Ave
- 2463 Hilgard Ave
Your Personal Tour Guide
Ask me questions while you tour the home.