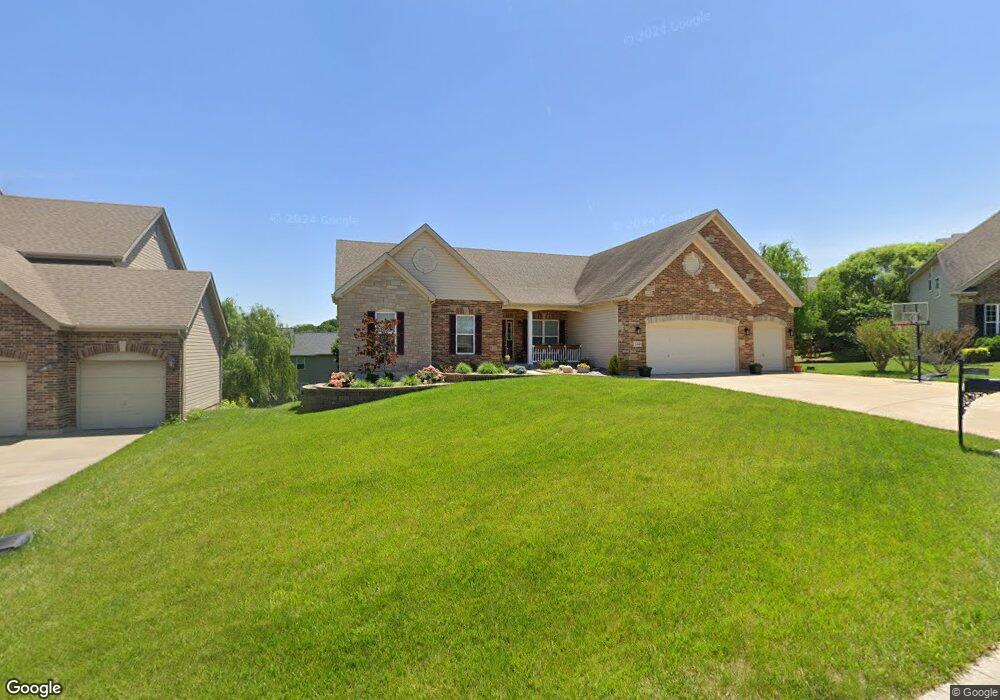
2448 Flowerdale Ct Eureka, MO 63025
Estimated Value: $539,000 - $645,000
Studio
1
Bath
2,909
Sq Ft
$203/Sq Ft
Est. Value
About This Home
This home is located at 2448 Flowerdale Ct, Eureka, MO 63025 and is currently estimated at $590,470, approximately $202 per square foot. 2448 Flowerdale Ct is a home with nearby schools including Geggie Elementary School, Lasalle Springs Middle School, and Eureka Senior High School.
Ownership History
Date
Name
Owned For
Owner Type
Purchase Details
Closed on
Oct 19, 2012
Sold by
Akers James E and Akers Donna L
Bought by
Akers James E and Akers Donna L
Current Estimated Value
Home Financials for this Owner
Home Financials are based on the most recent Mortgage that was taken out on this home.
Original Mortgage
$308,500
Outstanding Balance
$213,670
Interest Rate
3.59%
Mortgage Type
New Conventional
Estimated Equity
$376,800
Purchase Details
Closed on
Jul 26, 2010
Sold by
Akers James E and Akers Donna L
Bought by
Akers James E and Akers Donna L
Home Financials for this Owner
Home Financials are based on the most recent Mortgage that was taken out on this home.
Original Mortgage
$321,300
Interest Rate
4.69%
Mortgage Type
New Conventional
Purchase Details
Closed on
Sep 12, 2008
Sold by
Mcbride & Son Homes Inc
Bought by
Akers James E and Akers Donna L
Home Financials for this Owner
Home Financials are based on the most recent Mortgage that was taken out on this home.
Original Mortgage
$321,150
Interest Rate
6.6%
Mortgage Type
Purchase Money Mortgage
Create a Home Valuation Report for This Property
The Home Valuation Report is an in-depth analysis detailing your home's value as well as a comparison with similar homes in the area
Home Values in the Area
Average Home Value in this Area
Purchase History
We collect this data history from publicly available records. To have your information removed, we recommend requesting removal directly through your county’s website.
| Date | Buyer | Sale Price | Title Company |
|---|---|---|---|
| Akers James E | -- | None Available | |
| Akers James E | -- | None Available | |
| Akers James E | -- | Dependable Title Llc |
Source: Public Records
Mortgage History
We collect this data history from publicly available records. To have your information removed, we recommend requesting removal directly through your county’s website.
| Date | Status | Borrower | Loan Amount |
|---|---|---|---|
| Open | Akers James E | $308,500 | |
| Closed | Akers James E | $321,300 | |
| Closed | Akers James E | $321,150 |
Source: Public Records
Tax History
| Year | Tax Paid | Tax Assessment Tax Assessment Total Assessment is a certain percentage of the fair market value that is determined by local assessors to be the total taxable value of land and additions on the property. | Land | Improvement |
|---|---|---|---|---|
| 2025 | $5,641 | $89,100 | $10,700 | $78,400 |
| 2024 | $5,641 | $78,500 | $8,800 | $69,700 |
| 2023 | $5,641 | $78,500 | $8,800 | $69,700 |
| 2022 | $5,991 | $78,500 | $8,800 | $69,700 |
| 2021 | $5,947 | $78,500 | $8,800 | $69,700 |
| 2020 | $5,591 | $70,700 | $8,000 | $62,700 |
| 2019 | $5,625 | $70,700 | $8,000 | $62,700 |
| 2018 | $5,886 | $70,700 | $8,000 | $62,700 |
| 2017 | $5,418 | $70,700 | $8,000 | $62,700 |
| 2016 | $4,902 | $62,100 | $8,000 | $54,100 |
| 2015 | $4,904 | $62,100 | $8,000 | $54,100 |
| 2013 | $4,904 | $61,800 | $8,000 | $53,800 |
Source: Public Records
Map
Nearby Homes
- 1074 Bloomfield Dr
- 1057 Bloomfield Dr
- 174 Windfall Way
- 1049 Bloomfield Dr
- 2 Nottingham at Windswept Farms
- 1045 Bloomfield Dr
- 2 Sequoia at Windswept Farms
- 1142 Bloomfield Dr
- 2 Hermitage II at Windswept Farm
- 2 Pin Oak at Windswept Farms
- 734 Crested Point Dr
- 2 Maple Expanded at Windswept
- 105 Windfall Way
- 2 Hickory at Windswept Farms
- 1404 Bloomfield Dr
- 1412 Bloomfield Dr
- 1534 Cascade Ln
- 1387 Bloomfield Dr
- 1363 Bloomfield Dr
- 910 Boulder Crest Ct
- 2444Lot #300 Flowerdale Ct
- 2444 Flowerdale Ct
- 2444 Flowerdale Ct
- 2452 Flowerdale Ct
- 5245 Mirasol Manor Way
- 5241 Mirasol Manor Way Unit 287
- 5241 Mirasol Manor Way
- 5251 Mirasol Manor Way
- 2440Lot #299 Flowerdale Ct
- 2440 Flowerdale Ct
- 5237Lot 288 Mirasol Manor Way
- 5237 Mirasol Manor Way
- 2440 Flowerdale Ct
- 5257 Mirasol Manor Way
- 5237 Mirasol Manor Lot 288 Way
- 2456 Flowerdale Ct
- 5263 Mirasol Manor Way Unit 283
- 5263 Mirasol Manor Way
- 5233 Mirasol Manor Way
- 2 Fall Flower Ct
Your Personal Tour Guide
Ask me questions while you tour the home.