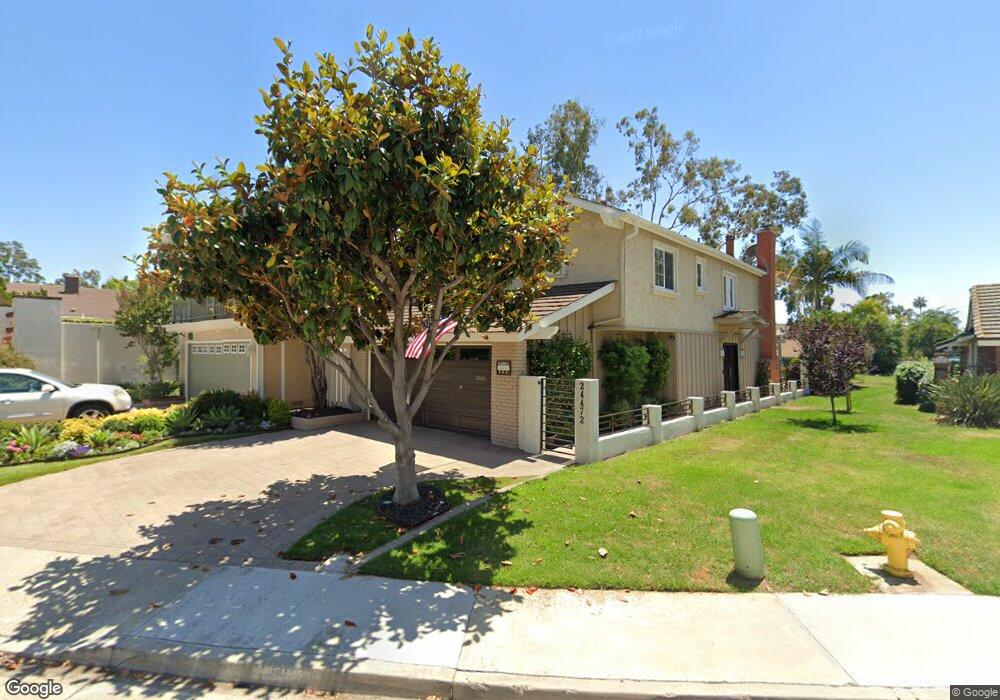
24482 Overlake Ln Lake Forest, CA 92630
Estimated Value: $1,310,474 - $1,514,000
5
Beds
3
Baths
2,329
Sq Ft
$598/Sq Ft
Est. Value
About This Home
This home is located at 24482 Overlake Ln, Lake Forest, CA 92630 and is currently estimated at $1,393,869, approximately $598 per square foot. 24482 Overlake Ln is a home located in Orange County with nearby schools including Santiago STEAM Magnet Elementary School, Serrano Intermediate School, and El Toro High School.
Ownership History
Date
Name
Owned For
Owner Type
Purchase Details
Closed on
Apr 17, 2007
Sold by
Hobbs Paul C and Hobbs Patricia
Bought by
Hobbs Paul C and Hobbs Patricia
Current Estimated Value
Purchase Details
Closed on
Mar 26, 2007
Sold by
Hobbs Paul C
Bought by
Hobbs Paul C and Westhoff Patricia
Purchase Details
Closed on
Jan 17, 2004
Sold by
Hobbs Paul C and Hobbs Susan L
Bought by
Hobbs Paul C and Hobbs Susan L
Purchase Details
Closed on
Oct 27, 1999
Sold by
Baer Charles R and Baer Patricia L
Bought by
Hobbs Paul C and Hobbs Susan L
Home Financials for this Owner
Home Financials are based on the most recent Mortgage that was taken out on this home.
Original Mortgage
$178,000
Interest Rate
7.96%
Purchase Details
Closed on
Jan 22, 1993
Sold by
Baer Charles R and Baer Patricia L
Bought by
Baer Charles R and Baer Patricia L
Create a Home Valuation Report for This Property
The Home Valuation Report is an in-depth analysis detailing your home's value as well as a comparison with similar homes in the area
Home Values in the Area
Average Home Value in this Area
Purchase History
| Date | Buyer | Sale Price | Title Company |
|---|---|---|---|
| Hobbs Paul C | -- | Accommodation | |
| Hobbs Paul C | -- | Accommodation | |
| Hobbs Paul C | -- | -- | |
| Hobbs Paul C | $325,000 | First Southwestern Title Co | |
| Baer Charles R | -- | -- |
Source: Public Records
Mortgage History
| Date | Status | Borrower | Loan Amount |
|---|---|---|---|
| Previous Owner | Hobbs Paul C | $178,000 |
Source: Public Records
Tax History Compared to Growth
Tax History
| Year | Tax Paid | Tax Assessment Tax Assessment Total Assessment is a certain percentage of the fair market value that is determined by local assessors to be the total taxable value of land and additions on the property. | Land | Improvement |
|---|---|---|---|---|
| 2025 | $5,106 | $502,897 | $323,150 | $179,747 |
| 2024 | $5,106 | $493,037 | $316,814 | $176,223 |
| 2023 | $4,985 | $483,370 | $310,602 | $172,768 |
| 2022 | $4,895 | $473,893 | $304,512 | $169,381 |
| 2021 | $4,796 | $464,601 | $298,541 | $166,060 |
| 2020 | $4,752 | $459,838 | $295,480 | $164,358 |
| 2019 | $4,656 | $450,822 | $289,686 | $161,136 |
| 2018 | $4,568 | $441,983 | $284,006 | $157,977 |
| 2017 | $4,476 | $433,317 | $278,437 | $154,880 |
| 2016 | $4,400 | $424,821 | $272,977 | $151,844 |
| 2015 | $4,346 | $418,440 | $268,876 | $149,564 |
| 2014 | $4,251 | $410,244 | $263,609 | $146,635 |
Source: Public Records
Map
Nearby Homes
- 22875 Ridge Route Ln
- 22576 Lake Forest Ln
- 22661 Pine Lake Ln
- 22627 Lakeside Ln
- 24210 Jasper Lake Ln Unit 52
- 22482 Lake Forest Ln
- 22682 S Canada Ct
- 22235 Vista Verde Dr
- 24802 Forest Knoll Ln
- 22941 Belquest Dr
- 24465 Peacock St
- 24001 Muirlands Blvd Unit 411
- 24001 Muirlands Blvd Unit 56
- 24001 Muirlands Blvd Unit 221
- 24001 Muirlands Blvd Unit 185
- 24001 Muirlands Blvd Unit 329
- 24001 Muirlands Blvd Unit 347
- 24001 Muirlands Blvd Unit 115
- 24001 Muirlands Blvd Unit 34
- 24001 Muirlands Blvd Unit 119
- 24472 Overlake Ln
- 24472 Overlake Dr
- 24492 Overlake Ln
- 24462 Overlake Ln
- 22691 Islamare Ln
- 22685 Islamare Ln
- 24452 Overlake Ln
- 22705 Islamare Ln
- 24442 Overlake Ln
- 24442 Overlake Dr
- 22703 Islamare Ln
- 22695 Islamare Ln
- 22681 Islamare Ln
- 22612 Coral Place
- 22715 Islamare Ln
- 24501 Overlake
- 22713 Islamare Ln
- 24432 Overlake Ln
- 22606 Coral Place
- 24515 Overlake