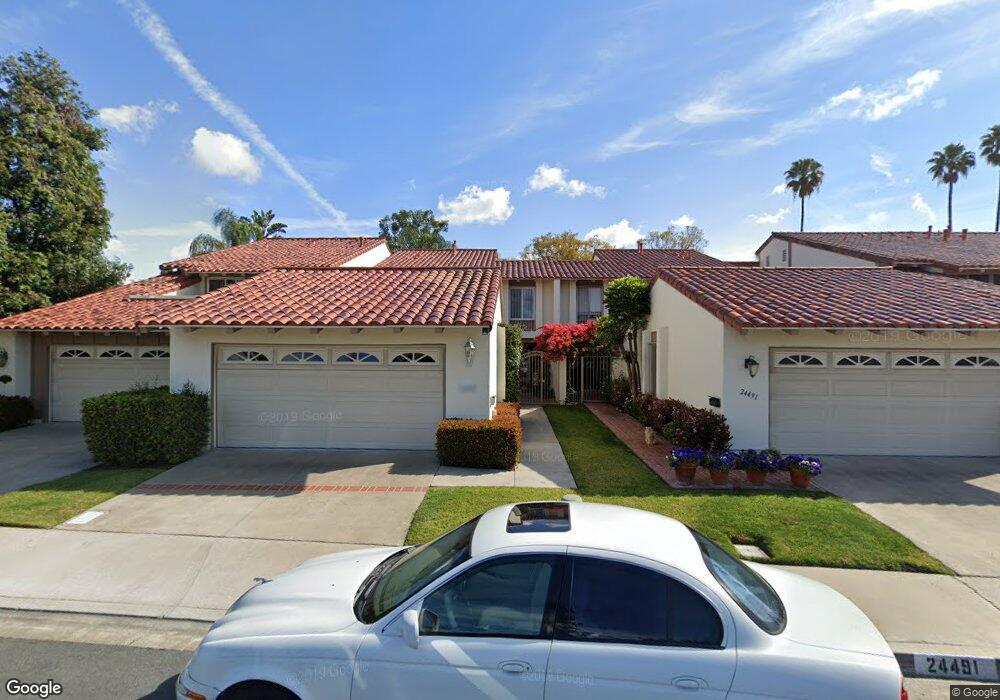
24485 Jeronimo Ln Lake Forest, CA 92630
Estimated Value: $1,464,000 - $2,244,000
4
Beds
3
Baths
2,492
Sq Ft
$754/Sq Ft
Est. Value
About This Home
This home is located at 24485 Jeronimo Ln, Lake Forest, CA 92630 and is currently estimated at $1,877,937, approximately $753 per square foot. 24485 Jeronimo Ln is a home located in Orange County with nearby schools including Rancho Canada Elementary School, Serrano Intermediate School, and El Toro High School.
Ownership History
Date
Name
Owned For
Owner Type
Purchase Details
Closed on
Oct 31, 2015
Sold by
Lin David
Bought by
Lin Y Sean and Lin Cybele J
Current Estimated Value
Purchase Details
Closed on
Sep 5, 2014
Sold by
Lin David
Bought by
Lin David and Sean Lin Y
Purchase Details
Closed on
Sep 22, 2009
Sold by
Jeronimo #24485 Partners
Bought by
Lin David
Home Financials for this Owner
Home Financials are based on the most recent Mortgage that was taken out on this home.
Original Mortgage
$200,000
Outstanding Balance
$122,674
Interest Rate
4%
Mortgage Type
New Conventional
Estimated Equity
$1,755,263
Purchase Details
Closed on
Jun 17, 2009
Sold by
Alinaghian Farah and Alinaghian Kazem
Bought by
Goldman 2006 Series 3 Trust and Goldenwest Capital Llc
Create a Home Valuation Report for This Property
The Home Valuation Report is an in-depth analysis detailing your home's value as well as a comparison with similar homes in the area
Home Values in the Area
Average Home Value in this Area
Purchase History
| Date | Buyer | Sale Price | Title Company |
|---|---|---|---|
| Lin Y Sean | -- | Accommodation | |
| Lin David | -- | Accommodation | |
| Lin David | $530,000 | None Available | |
| Jeronimo #24485 Partners | -- | None Available | |
| Goldman 2006 Series 3 Trust | -- | Accommodation |
Source: Public Records
Mortgage History
| Date | Status | Borrower | Loan Amount |
|---|---|---|---|
| Open | Lin David | $200,000 |
Source: Public Records
Tax History Compared to Growth
Tax History
| Year | Tax Paid | Tax Assessment Tax Assessment Total Assessment is a certain percentage of the fair market value that is determined by local assessors to be the total taxable value of land and additions on the property. | Land | Improvement |
|---|---|---|---|---|
| 2025 | $6,967 | $684,129 | $445,932 | $238,197 |
| 2024 | $6,967 | $670,715 | $437,188 | $233,527 |
| 2023 | $6,801 | $657,564 | $428,615 | $228,949 |
| 2022 | $6,679 | $644,671 | $420,211 | $224,460 |
| 2021 | $6,545 | $632,031 | $411,972 | $220,059 |
| 2020 | $6,486 | $625,551 | $407,748 | $217,803 |
| 2019 | $6,355 | $613,286 | $399,753 | $213,533 |
| 2018 | $6,235 | $601,261 | $391,914 | $209,347 |
| 2017 | $6,109 | $589,472 | $384,229 | $205,243 |
| 2016 | $6,007 | $577,914 | $376,695 | $201,219 |
| 2015 | $6,005 | $569,234 | $371,037 | $198,197 |
| 2014 | $5,576 | $536,414 | $349,643 | $186,771 |
Source: Public Records
Map
Nearby Homes
- 24465 Peacock St
- 22235 Vista Verde Dr
- 21922 Erie Ln
- 21886 Winnebago Ln
- 24311 Peacock St
- 21907 Erie Ln
- 24708 Toledo Ln
- 21875 Huron Ln
- 21761 Tahoe Ln
- 24771 Summerwind Ln
- 21992 Hoi Cir
- 24661 Woodhill Ln
- 24802 Forest Knoll Ln
- 21655 Superior Ln
- 22482 Lake Forest Ln
- 24001 Muirlands Blvd Unit 31
- 24001 Muirlands Blvd Unit 347
- 24001 Muirlands Blvd Unit 47
- 24001 Muirlands Blvd Unit 138
- 24001 Muirlands Blvd Unit 333
- 24491 Jeronimo Ln
- 24481 Jeronimo Ln
- 24495 Jeronimo Ln
- 24499 Jeronimo Ln
- 24501 Jeronimo Ln
- 22058 Arrowhead Ln
- 24503 Jeronimo Ln
- 22054 Arrowhead Ln
- 22057 Arrowhead Ln
- 24505 Jeronimo Ln
- 22055 Arrowhead Ln
- 22061 Arrowhead Ln
- 22051 Arrowhead Ln
- 22052 Arrowhead Ln
- 22048 Arrowhead Ln
- 22041 Arrowhead Ln
- 22037 Arrowhead Ln
- 24451 Peacock St
- 22044 Arrowhead Ln
- 22035 Arrowhead Ln