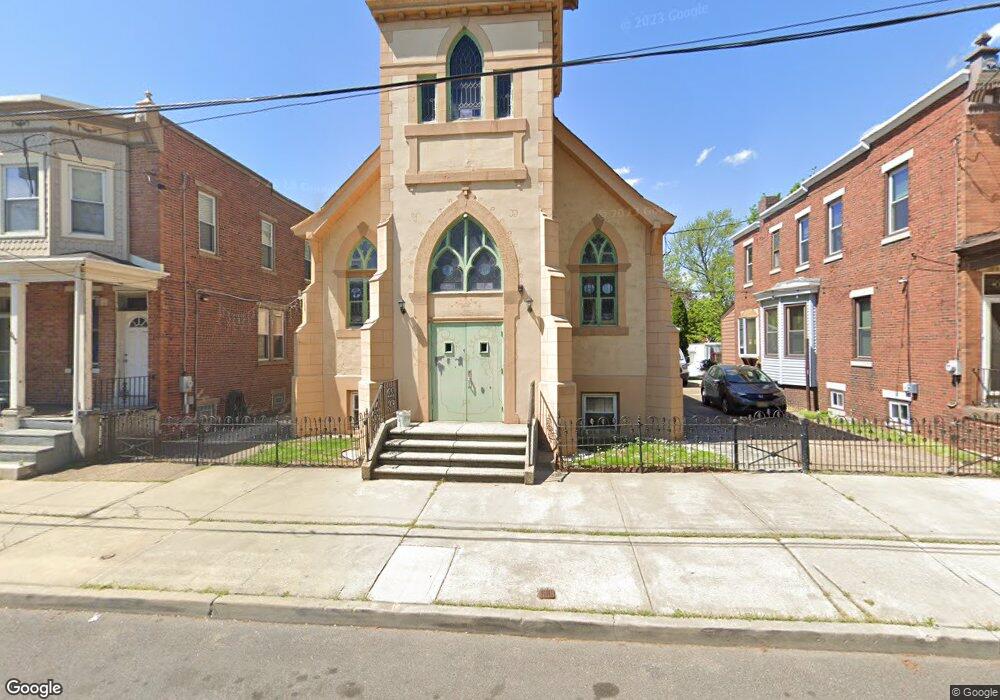
245 4th St Gloucester City, NJ 08030
Estimated Value: $191,000 - $437,000
--
Bed
--
Bath
4,850
Sq Ft
$65/Sq Ft
Est. Value
About This Home
This home is located at 245 4th St, Gloucester City, NJ 08030 and is currently estimated at $315,617, approximately $65 per square foot. 245 4th St is a home located in Camden County with nearby schools including Cold Springs School, Gloucester City Middle School, and Gloucester City Junior/Senior High School.
Ownership History
Date
Name
Owned For
Owner Type
Purchase Details
Closed on
Aug 21, 2007
Sold by
Nolan Martin W
Bought by
Nolan Martin W
Current Estimated Value
Purchase Details
Closed on
Aug 21, 2006
Sold by
Lynn Jeffrey
Bought by
Nolan Martin W
Purchase Details
Closed on
Apr 10, 2003
Sold by
Spirit Of Hope Lutheran Church
Bought by
Lynn Jeffrey
Create a Home Valuation Report for This Property
The Home Valuation Report is an in-depth analysis detailing your home's value as well as a comparison with similar homes in the area
Home Values in the Area
Average Home Value in this Area
Purchase History
| Date | Buyer | Sale Price | Title Company |
|---|---|---|---|
| Nolan Martin W | -- | -- | |
| Nolan Martin W | $120,000 | -- | |
| Nolan Martin W | $120,000 | -- | |
| Lynn Jeffrey | $120,000 | -- |
Source: Public Records
Tax History Compared to Growth
Tax History
| Year | Tax Paid | Tax Assessment Tax Assessment Total Assessment is a certain percentage of the fair market value that is determined by local assessors to be the total taxable value of land and additions on the property. | Land | Improvement |
|---|---|---|---|---|
| 2025 | $7,259 | $144,800 | $30,200 | $114,600 |
| 2024 | $7,246 | $144,800 | $30,200 | $114,600 |
| 2023 | $7,246 | $144,800 | $30,200 | $114,600 |
| 2022 | $6,813 | $144,800 | $30,200 | $114,600 |
| 2021 | $6,745 | $144,800 | $30,200 | $114,600 |
| 2020 | $6,513 | $144,800 | $30,200 | $114,600 |
| 2019 | $5,459 | $123,900 | $28,600 | $95,300 |
| 2018 | $5,352 | $123,900 | $28,600 | $95,300 |
| 2017 | $5,242 | $123,900 | $28,600 | $95,300 |
| 2016 | $5,044 | $123,900 | $28,600 | $95,300 |
| 2015 | $4,542 | $123,900 | $28,600 | $95,300 |
| 2014 | $4,721 | $90,000 | $38,300 | $51,700 |
Source: Public Records
Map
Nearby Homes
- 315 Hunter St
- 412 Market St
- 228 Orange St
- 314 Ridgeway St
- 312 Ridgeway St
- 424 Hunter St
- 405 Jersey Ave
- 225 Market St
- 326 Jersey Ave
- 207 Powell St
- 230 Cumberland St
- 513 1/2 Market St
- 423 Cumberland St
- 207 Cumberland St
- 218 Somerset St
- 614 Hunter St
- 619 Powell St
- 633 Market St
- 223 Ridgeway St
- 30 S Broadway