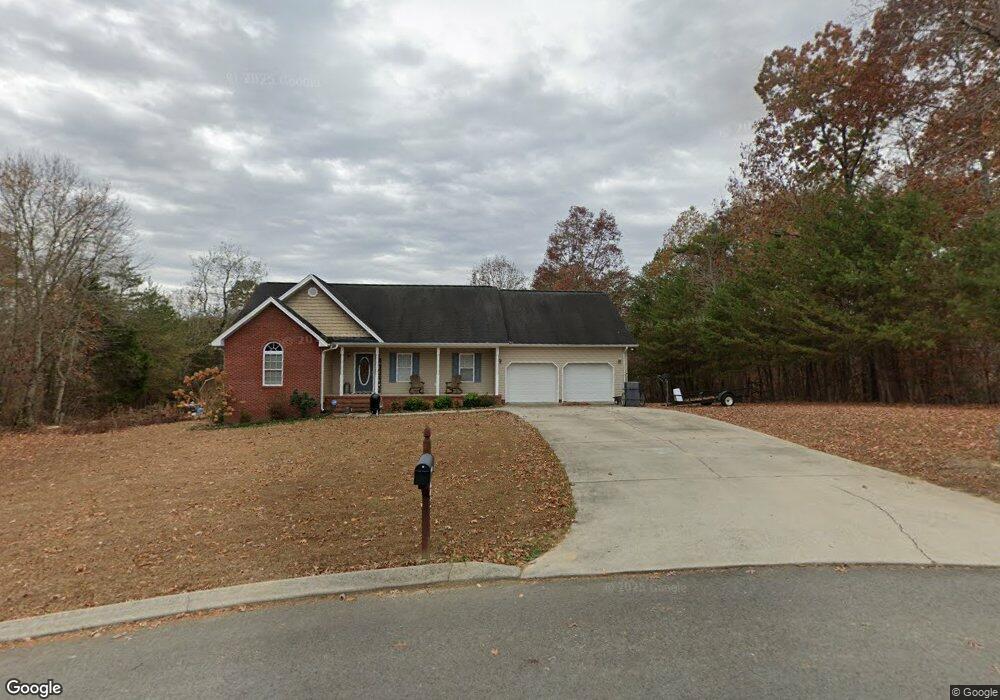
245 Hidden Ridge Loop Dunlap, TN 37327
Estimated Value: $355,949 - $513,000
3
Beds
2
Baths
1,873
Sq Ft
$217/Sq Ft
Est. Value
About This Home
This home is located at 245 Hidden Ridge Loop, Dunlap, TN 37327 and is currently estimated at $405,737, approximately $216 per square foot. 245 Hidden Ridge Loop is a home located in Sequatchie County with nearby schools including Griffith Elementary School, Sequatchie County Middle School, and Sequatchie County High School.
Ownership History
Date
Name
Owned For
Owner Type
Purchase Details
Closed on
Oct 3, 2016
Sold by
Roorda Bennie D
Bought by
Smith Nathan J and Smith Lynsey M
Current Estimated Value
Purchase Details
Closed on
Dec 17, 2015
Sold by
Dean Bennie C
Bought by
Smith Lynsey M and Smith Nathan J
Home Financials for this Owner
Home Financials are based on the most recent Mortgage that was taken out on this home.
Original Mortgage
$174,775
Interest Rate
3.75%
Mortgage Type
FHA
Purchase Details
Closed on
Dec 21, 2011
Sold by
Roorda Bennie D
Bought by
Dean Bennie C
Home Financials for this Owner
Home Financials are based on the most recent Mortgage that was taken out on this home.
Original Mortgage
$120,000
Interest Rate
4.07%
Mortgage Type
Commercial
Purchase Details
Closed on
Dec 15, 2003
Sold by
Heath Bolton
Bought by
Roorda Bennie D
Purchase Details
Closed on
Feb 4, 2003
Bought by
Bolton Heath and Wife Rhonda
Create a Home Valuation Report for This Property
The Home Valuation Report is an in-depth analysis detailing your home's value as well as a comparison with similar homes in the area
Home Values in the Area
Average Home Value in this Area
Purchase History
| Date | Buyer | Sale Price | Title Company |
|---|---|---|---|
| Smith Nathan J | $11,500 | -- | |
| Smith Lynsey M | $178,000 | -- | |
| Dean Bennie C | -- | -- | |
| Roorda Bennie D | $155,000 | -- | |
| Bolton Heath | $8,500 | -- |
Source: Public Records
Mortgage History
| Date | Status | Borrower | Loan Amount |
|---|---|---|---|
| Previous Owner | Smith Lynsey M | $174,775 | |
| Previous Owner | Dean Bennie C | $120,000 |
Source: Public Records
Tax History
| Year | Tax Paid | Tax Assessment Tax Assessment Total Assessment is a certain percentage of the fair market value that is determined by local assessors to be the total taxable value of land and additions on the property. | Land | Improvement |
|---|---|---|---|---|
| 2025 | $1,195 | $65,050 | $5,000 | $60,050 |
| 2024 | $1,195 | $65,050 | $5,000 | $60,050 |
| 2023 | $1,195 | $65,050 | $5,000 | $60,050 |
| 2022 | $965 | $39,525 | $3,650 | $35,875 |
| 2021 | $965 | $39,525 | $3,650 | $35,875 |
| 2020 | $930 | $38,075 | $3,650 | $34,425 |
| 2019 | $930 | $38,075 | $3,650 | $34,425 |
| 2018 | $930 | $38,075 | $3,650 | $34,425 |
| 2017 | $930 | $38,075 | $3,650 | $34,425 |
| 2016 | $973 | $37,875 | $3,650 | $34,225 |
| 2015 | $973 | $37,875 | $3,650 | $34,225 |
| 2014 | $973 | $37,875 | $3,650 | $34,225 |
Source: Public Records
Map
Nearby Homes
- 118 Hidden Ridge Loop
- 438 Highland Dr
- 347 Highland Dr
- 152 Highland Dr
- 0 Hardin Rd Unit 1523572
- 0 Hardin Rd Unit 1321169
- 74 Hardin Rd
- 5 Treeline Dr
- 4 Treeline Dr
- 000 Hudlow Loop Rd
- 0 Treeline Dr Unit 1510685
- 0 Treeline Dr Unit RTC2815537
- 0 Treeline Dr Unit 1510684
- 0 Treeline Dr Unit RTC2815536
- 220 Little Ponderosa Trail
- 67 Shady Oaks Cove
- 0 Shady Oaks Cove Unit 1525918
- 0 Hudlow Loop Rd Unit 1523968
- 0 Hudlow Loop Rd Unit 1511092
- 0 Hudlow Loop Rd Unit RTC3045642
- 197 Hidden Ridge Loop
- 210 Hidden Ridge Loop
- 279 Hidden Ridge Loop
- 298 Hidden Ridge Loop
- 0 Hidden Ridge Loop Unit RTC2987333
- 0 Hidden Ridge Loop Unit RTC2987334
- 0 Hidden Ridge Loop Unit 1255845
- 0 Hidden Ridge Loop Unit 1255829
- 0 Hidden Ridge Loop Unit 1255796
- 0 Hidden Ridge Loop Unit 1255857
- 0 Hidden Ridge Loop Unit 1255836
- 0 Hidden Ridge Loop Unit 1255816
- 0 Hidden Ridge Loop Unit 1213104
- 0 Hidden Ridge Loop Unit RTC2418272
- 0 Hidden Ridge Loop Unit RTC2731356
- 0 Hidden Ridge Loop Unit RTC2731366
- 0 Hidden Ridge Loop Unit RTC2731362
- 0 Hidden Ridge Loop Unit 1191277
- 0 Hidden Ridge Loop Unit 1387355
- 0 Hidden Ridge Loop Unit 1390210
Your Personal Tour Guide
Ask me questions while you tour the home.