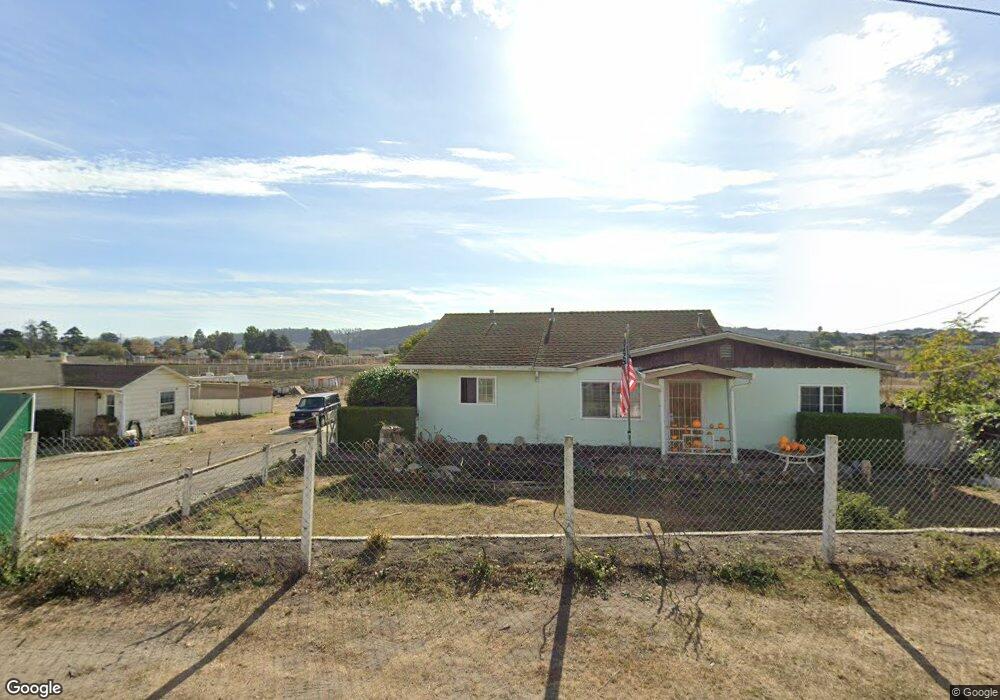
245 Hudson Landing Rd Royal Oaks, CA 95076
Estimated Value: $614,364 - $809,000
4
Beds
1
Bath
1,366
Sq Ft
$510/Sq Ft
Est. Value
About This Home
This home is located at 245 Hudson Landing Rd, Royal Oaks, CA 95076 and is currently estimated at $697,341, approximately $510 per square foot. 245 Hudson Landing Rd is a home located in Monterey County with nearby schools including Ohlone Elementary School, Pajaro Middle School, and Watsonville High School.
Ownership History
Date
Name
Owned For
Owner Type
Purchase Details
Closed on
Jan 31, 2023
Sold by
Salgado Joseph A
Bought by
Trust Of Joseph A Salgado and Salgado
Current Estimated Value
Purchase Details
Closed on
Jun 24, 2021
Sold by
Paul Salgado Sr John
Bought by
John Paul Salgado Sr Family Trust
Purchase Details
Closed on
Apr 21, 2021
Sold by
John Paul Salgado Sr Family Trust and Salgado John Paul
Bought by
Salgado Joseph
Purchase Details
Closed on
May 10, 2017
Sold by
Salgado John Paul
Bought by
Salgado John Paul
Purchase Details
Closed on
Sep 2, 2005
Sold by
Salgado Joseph A
Bought by
Salgado John P
Purchase Details
Closed on
Oct 16, 1997
Sold by
Salgado John and Salgado Barbara
Bought by
Salgado John P and Salgado Barbara J
Purchase Details
Closed on
Sep 25, 1997
Sold by
Salgado John and Salgado Barbara
Bought by
Salgado John P and Salgado Barbara J
Create a Home Valuation Report for This Property
The Home Valuation Report is an in-depth analysis detailing your home's value as well as a comparison with similar homes in the area
Home Values in the Area
Average Home Value in this Area
Purchase History
| Date | Buyer | Sale Price | Title Company |
|---|---|---|---|
| Trust Of Joseph A Salgado | -- | None Listed On Document | |
| John Paul Salgado Sr Family Trust | -- | -- | |
| Salgado Joseph | -- | None Listed On Document | |
| John Paul Salgado Sr Family Trust | -- | -- | |
| Salgado John Paul | -- | None Available | |
| Salgado John P | -- | -- | |
| Salgado John P | -- | -- | |
| Salgado John P | -- | -- | |
| Salgado John P | -- | -- |
Source: Public Records
Tax History Compared to Growth
Tax History
| Year | Tax Paid | Tax Assessment Tax Assessment Total Assessment is a certain percentage of the fair market value that is determined by local assessors to be the total taxable value of land and additions on the property. | Land | Improvement |
|---|---|---|---|---|
| 2025 | $609 | $36,963 | $15,693 | $21,270 |
| 2024 | $609 | $36,239 | $15,386 | $20,853 |
| 2023 | $518 | $35,530 | $15,085 | $20,445 |
| 2022 | $583 | $34,835 | $14,790 | $20,045 |
| 2021 | $553 | $34,152 | $14,500 | $19,652 |
| 2020 | $439 | $33,803 | $14,352 | $19,451 |
| 2019 | $431 | $33,141 | $14,071 | $19,070 |
| 2018 | $424 | $32,493 | $13,796 | $18,697 |
| 2017 | $421 | $31,857 | $13,526 | $18,331 |
| 2016 | $411 | $31,233 | $13,261 | $17,972 |
| 2015 | $415 | $30,765 | $13,062 | $17,703 |
| 2014 | $408 | $30,164 | $12,807 | $17,357 |
Source: Public Records
Map
Nearby Homes
- 22 Easton Rd
- 2100 Stone Ridge Dr
- 2600 Garin Rd
- 2505 Garin Rd
- 43 Acres Sill Rd
- 00 Bluff Rd
- 1900 Highway 1 Unit 104
- 1900 Highway 1 Unit 82
- 1900 Highway 1 Unit 62
- 125 Springfield Rd
- 1970 Beach Rd
- 1630 W Beach St
- 101 W Front St Unit 6
- 1900 California 1 Unit 63
- 175 Johnson Rd
- 837 Lewis Rd
- 219 2nd St
- 817 Lewis Rd
- 124 E Riverside Dr
- 128 Maple Ave
- 241 Hudson Landing Rd
- 253 Hudson Landing Rd
- 237 Hudson Landing Rd
- 250 Hudson Landing Rd
- 261 Hudson Landing Rd
- 225 Hudson Landing Rd
- 240 Wells Rd
- 219 Hudson Landing Rd
- 263 Hudson Landing Rd
- 277 Hudson Landing Rd
- 211 Hudson Landing Rd Unit B
- 200 Hudson Landing Rd
- 279 Hudson Landing Rd
- 209 Hudson Landing Rd
- 411 Elkhorn Rd
- 232 Hudson Landing Rd
- 55 Spring Rd
- 435 Elkhorn Rd
- 195 Hudson Landing Rd
- 16 Easton Rd