D
Seller's Agent in 2019
Donna Hawkins
Delegated Properties
(832) 877-9766
5 Total Sales

Estimated Value: $134,000 - $183,000
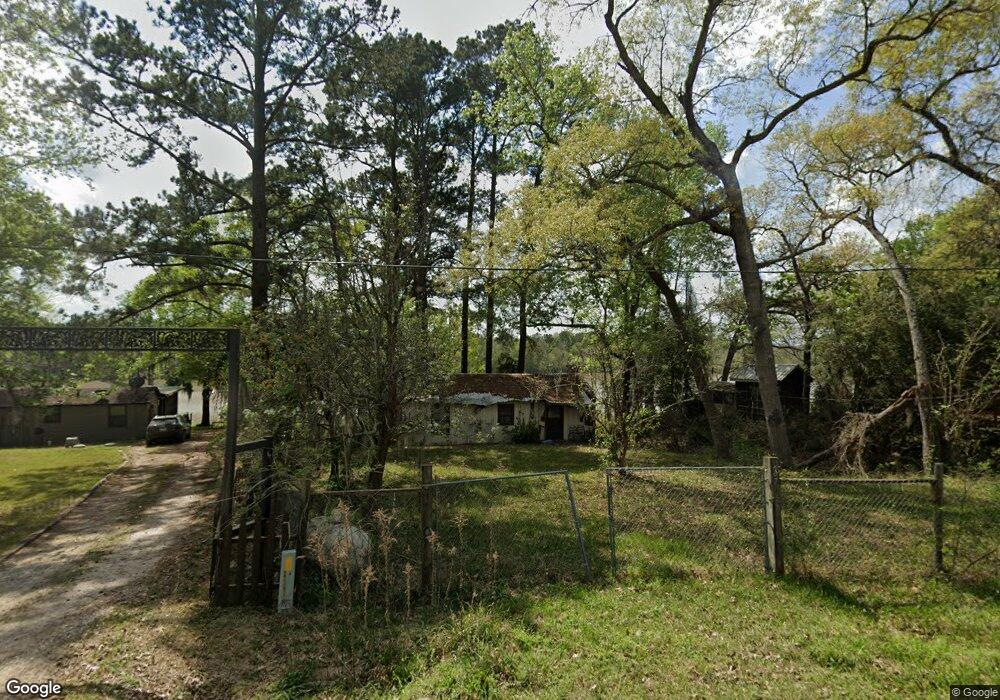
Super cute 2 bedroom lake house with fabulous views! Almost entire house redone including kitchen with new granite counters/ island, appliances, fixtures, floors, more!! New central A/C system 2017. Screened porch is wonderful and almost as big as the house at almost 700 sq. feet! New porch and pier also! Great location on Lake Gerlach with 70' lake frontage. Don't miss this one!
Last Agent to Sell the Property
Delegated Properties License #0389918 Listed on: 04/01/2019

| Date | Buyer | Sale Price | Title Company |
|---|---|---|---|
| Conner Chad Everette | -- | None Available | |
| Brakefield Jonmarc | -- | None Available | |
| Ferrante Stephanie | -- | -- |
| Date | Status | Borrower | Loan Amount |
|---|---|---|---|
| Open | Conner Chad Everette | $122,735 | |
| Previous Owner | Ferrante Stephanie | $40,000 |
| Date | Event | Price | List to Sale | Price per Sq Ft |
|---|---|---|---|---|
| 08/18/2024 08/18/24 | Off Market | -- | -- | -- |
| 07/31/2019 07/31/19 | Sold | -- | -- | -- |
| 07/01/2019 07/01/19 | Pending | -- | -- | -- |
| 04/01/2019 04/01/19 | For Sale | $149,000 | -- | $190 / Sq Ft |
| Year | Tax Paid | Tax Assessment Tax Assessment Total Assessment is a certain percentage of the fair market value that is determined by local assessors to be the total taxable value of land and additions on the property. | Land | Improvement |
|---|---|---|---|---|
| 2025 | $1,853 | $137,352 | $33,775 | $103,577 |
| 2024 | $1,684 | $123,294 | $27,020 | $96,274 |
| 2023 | $1,502 | $124,023 | $27,020 | $97,003 |
| 2022 | $1,585 | $94,383 | $12,835 | $81,548 |
| 2021 | $1,617 | $87,833 | $12,835 | $74,998 |
| 2020 | $1,480 | $75,174 | $7,431 | $67,743 |
| 2019 | $1,531 | $75,174 | $7,431 | $67,743 |
| 2018 | -- | $71,296 | $7,431 | $63,865 |
| 2017 | $1,363 | $66,922 | $7,431 | $59,491 |
| 2016 | $1,321 | $64,859 | $7,431 | $57,428 |
| 2015 | -- | $64,309 | $7,431 | $56,878 |
| 2014 | -- | $63,177 | $7,431 | $55,746 |
D
Seller's Agent in 2019
Donna Hawkins
Delegated Properties
(832) 877-9766
5 Total Sales
B
Buyer's Agent in 2019
Brent Borden
Walzel Properties - Galleria
(281) 292-4718
21 Total Sales
Source: Houston Association of REALTORS®
MLS Number: 16117575
APN: H1200-0280-00
Disclaimer: Certain information contained herein is derived from information provided by parties other than Homes.com. All information provided is deemed reliable, but is not guaranteed to be accurate and should be independently verified.
![]() Copyright 2026, Houston REALTORS® Information Service, Inc.
Copyright 2026, Houston REALTORS® Information Service, Inc.
The information provided is exclusively for consumers’ personal, non-commercial use, and may not be used for any purpose other than to identify prospective properties consumers may be interested in purchasing.
Information is deemed reliable but not guaranteed.
Ask me questions while you tour the home.