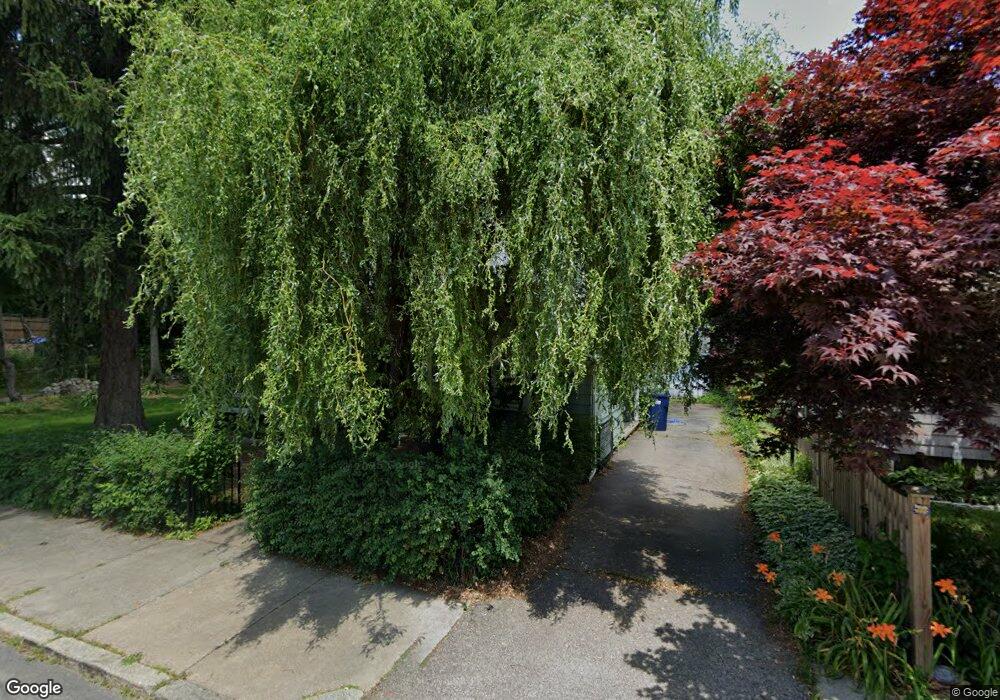
245 Maple St West Roxbury, MA 02132
West Roxbury NeighborhoodEstimated Value: $801,000 - $916,000
4
Beds
2
Baths
1,544
Sq Ft
$555/Sq Ft
Est. Value
About This Home
This home is located at 245 Maple St, West Roxbury, MA 02132 and is currently estimated at $856,850, approximately $554 per square foot. 245 Maple St is a home located in Suffolk County with nearby schools including Holy Name Parish School, St Theresa School, and The Roxbury Latin School.
Ownership History
Date
Name
Owned For
Owner Type
Purchase Details
Closed on
Jul 19, 2018
Sold by
Geffen-Leendert P and Geffen Dalia
Bought by
Geffen Leendert P
Current Estimated Value
Purchase Details
Closed on
Nov 8, 2004
Sold by
Tadmor Gilead
Bought by
Geffen Paul and Geffen Dalia
Home Financials for this Owner
Home Financials are based on the most recent Mortgage that was taken out on this home.
Original Mortgage
$200,000
Interest Rate
5.71%
Mortgage Type
Purchase Money Mortgage
Purchase Details
Closed on
Apr 7, 1999
Sold by
Davenport Katherine M
Bought by
Tadmor Gileand
Create a Home Valuation Report for This Property
The Home Valuation Report is an in-depth analysis detailing your home's value as well as a comparison with similar homes in the area
Home Values in the Area
Average Home Value in this Area
Purchase History
| Date | Buyer | Sale Price | Title Company |
|---|---|---|---|
| Geffen Leendert P | -- | -- | |
| Geffen Paul | $456,000 | -- | |
| Tadmor Gileand | $290,000 | -- |
Source: Public Records
Mortgage History
| Date | Status | Borrower | Loan Amount |
|---|---|---|---|
| Previous Owner | Tadmor Gileand | $240,000 | |
| Previous Owner | Tadmor Gileand | $200,000 | |
| Previous Owner | Tadmor Gileand | $166,000 |
Source: Public Records
Tax History
| Year | Tax Paid | Tax Assessment Tax Assessment Total Assessment is a certain percentage of the fair market value that is determined by local assessors to be the total taxable value of land and additions on the property. | Land | Improvement |
|---|---|---|---|---|
| 2025 | $8,455 | $730,100 | $243,800 | $486,300 |
| 2024 | $7,689 | $705,400 | $256,200 | $449,200 |
| 2023 | $7,145 | $665,300 | $241,600 | $423,700 |
| 2022 | $6,580 | $604,800 | $219,600 | $385,200 |
| 2021 | $6,030 | $565,100 | $211,200 | $353,900 |
| 2020 | $5,718 | $541,500 | $193,300 | $348,200 |
| 2019 | $5,331 | $505,800 | $173,400 | $332,400 |
| 2018 | $5,097 | $486,400 | $173,400 | $313,000 |
| 2017 | $5,099 | $481,500 | $173,400 | $308,100 |
| 2016 | $4,950 | $450,000 | $173,400 | $276,600 |
| 2015 | $5,510 | $455,000 | $202,800 | $252,200 |
| 2014 | $5,399 | $429,200 | $202,800 | $226,400 |
Source: Public Records
Map
Nearby Homes
- 36 Worley St
- 104 Greaton Rd
- 40 Newfield St
- 170 Bonad Rd
- 72 Redlands Rd
- 72-74 Manthorne Rd Unit 74
- 100 Anderer Ln Unit 2
- 55 Redlands Rd
- 37 Hastings St Unit 201
- 227 Bonad Rd
- 25 Clearwater Rd
- 28 Westgate Rd Unit 3
- 96 Theodore Parker Rd
- 23 Atlantis St
- 923 Lagrange St
- 27 Richwood St
- 76 Lasell St
- 50-56 Broadlawn Park Unit 221
- 42 Bryon Rd Unit 6
- 66 Bryon Rd Unit 2
Your Personal Tour Guide
Ask me questions while you tour the home.