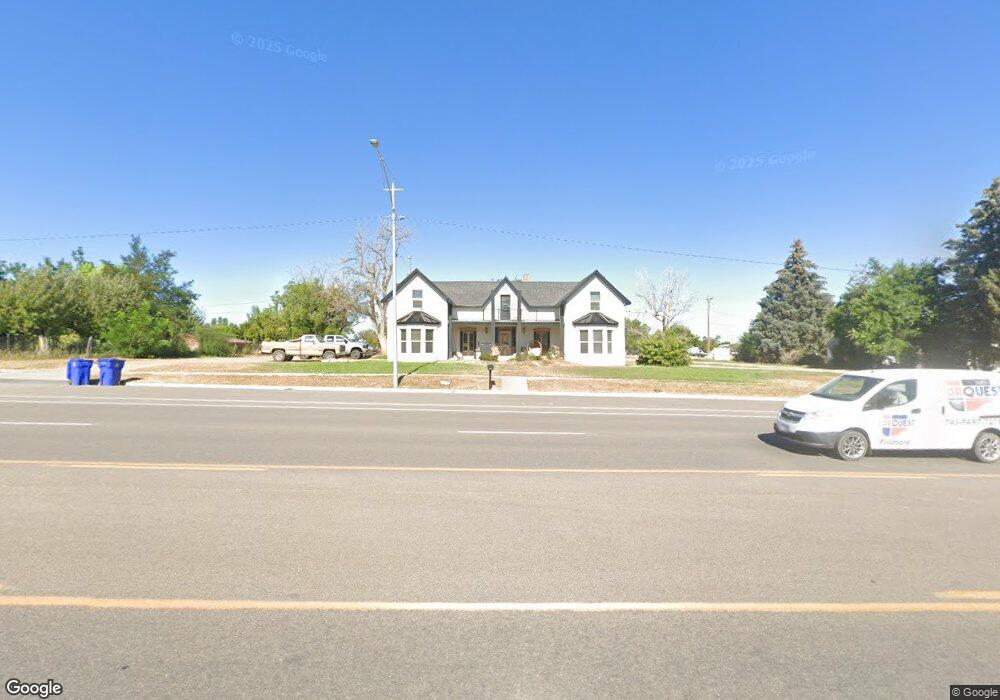
245 N Main St Fillmore, UT 84631
Estimated Value: $404,000 - $461,000
5
Beds
2
Baths
2,064
Sq Ft
$210/Sq Ft
Est. Value
About This Home
This home is located at 245 N Main St, Fillmore, UT 84631 and is currently estimated at $433,457, approximately $210 per square foot. 245 N Main St is a home located in Millard County.
Ownership History
Date
Name
Owned For
Owner Type
Purchase Details
Closed on
Jul 19, 2016
Sold by
Bunker Jennifer
Bought by
Gingrass Jennifer
Current Estimated Value
Purchase Details
Closed on
Oct 2, 2014
Sold by
Bunker Richard D and Bunker Jennifer
Bought by
Bunker Jennifer
Purchase Details
Closed on
Apr 21, 2008
Sold by
White Harolene H and Sorensen Linda Gae Huntsman
Bought by
Bunker Richard D and Bunker Jennifer
Home Financials for this Owner
Home Financials are based on the most recent Mortgage that was taken out on this home.
Original Mortgage
$68,600
Interest Rate
5.81%
Mortgage Type
New Conventional
Purchase Details
Closed on
Mar 10, 2008
Sold by
White Harolene H and Sorensen Linda Gae Huntsman
Bought by
White Harolene H and Sorensen Linda Gae Huntsman
Home Financials for this Owner
Home Financials are based on the most recent Mortgage that was taken out on this home.
Original Mortgage
$68,600
Interest Rate
5.81%
Mortgage Type
New Conventional
Create a Home Valuation Report for This Property
The Home Valuation Report is an in-depth analysis detailing your home's value as well as a comparison with similar homes in the area
Home Values in the Area
Average Home Value in this Area
Purchase History
| Date | Buyer | Sale Price | Title Company |
|---|---|---|---|
| Gingrass Jennifer | -- | First American Title | |
| Bunker Jennifer | -- | -- | |
| Bunker Richard D | -- | -- | |
| White Harolene H | -- | -- |
Source: Public Records
Mortgage History
| Date | Status | Borrower | Loan Amount |
|---|---|---|---|
| Previous Owner | Bunker Richard D | $68,600 |
Source: Public Records
Tax History
| Year | Tax Paid | Tax Assessment Tax Assessment Total Assessment is a certain percentage of the fair market value that is determined by local assessors to be the total taxable value of land and additions on the property. | Land | Improvement |
|---|---|---|---|---|
| 2025 | $1,985 | $249,360 | $54,780 | $194,580 |
| 2024 | $1,985 | $197,091 | $52,576 | $144,515 |
| 2023 | $2,090 | $197,091 | $52,576 | $144,515 |
| 2022 | $1,726 | $155,011 | $47,797 | $107,214 |
| 2021 | $1,456 | $125,488 | $31,037 | $94,451 |
| 2020 | $1,199 | $103,944 | $28,215 | $75,729 |
| 2019 | $1,049 | $91,277 | $28,215 | $63,062 |
| 2018 | $1,005 | $89,498 | $28,215 | $61,283 |
| 2017 | $813 | $68,792 | $22,671 | $46,121 |
| 2016 | $777 | $68,792 | $22,671 | $46,121 |
| 2015 | $778 | $68,792 | $22,671 | $46,121 |
| 2014 | -- | $68,792 | $22,671 | $46,121 |
| 2013 | -- | $68,792 | $22,671 | $46,121 |
Source: Public Records
Map
Nearby Homes
- 390 N 100 W
- 75 N 100 West St
- 225 W 200 St N
- 245 W 300 N
- 155 W Center St
- 40 S 100 Rd E
- 335 W 400 North St
- 351 W 100 South St
- 260 W 200 S
- 220 S 200 E
- 235 S 200 St E
- 410 W 400 N
- 465 S 100 W
- 310 S 500 West Rd
- 155 E 500 St S
- 157 E 500 South St
- 405 E 500 St S
- 2155 N Cedar Mountain Rd
- 2835 N Cedar Mountain Rd
- 690 E 500 S
Your Personal Tour Guide
Ask me questions while you tour the home.