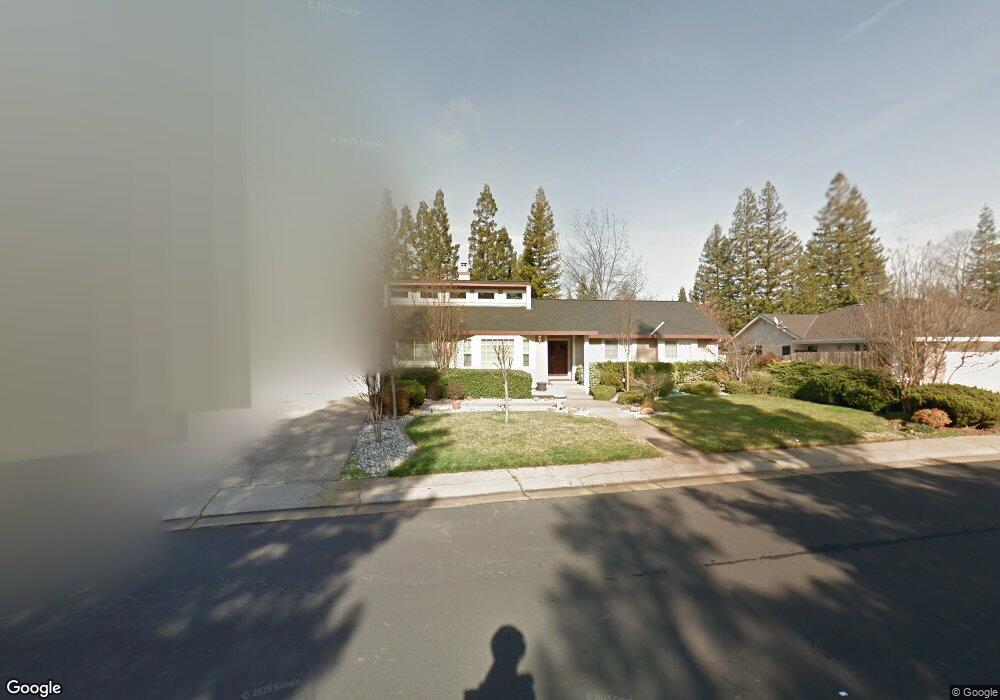
245 Randall Dr Folsom, CA 95630
Briggs Ranch NeighborhoodEstimated Value: $821,000 - $920,000
4
Beds
3
Baths
2,360
Sq Ft
$362/Sq Ft
Est. Value
About This Home
This home is located at 245 Randall Dr, Folsom, CA 95630 and is currently estimated at $854,538, approximately $362 per square foot. 245 Randall Dr is a home located in Sacramento County with nearby schools including Blanche Sprentz Elementary School, Sutter Middle School, and St. John Notre Dame.
Ownership History
Date
Name
Owned For
Owner Type
Purchase Details
Closed on
Apr 18, 2006
Sold by
May Shaneen A
Bought by
May Todd M
Current Estimated Value
Home Financials for this Owner
Home Financials are based on the most recent Mortgage that was taken out on this home.
Original Mortgage
$440,000
Outstanding Balance
$252,707
Interest Rate
6.35%
Mortgage Type
New Conventional
Estimated Equity
$601,831
Purchase Details
Closed on
Jul 17, 1998
Sold by
Kernan Michael A and Kernan Carolyn Kay
Bought by
May Todd M and May Shaneen A
Home Financials for this Owner
Home Financials are based on the most recent Mortgage that was taken out on this home.
Original Mortgage
$192,000
Interest Rate
6.9%
Purchase Details
Closed on
May 27, 1997
Sold by
Behling Brian D and Behling Erika
Bought by
Kernan Michael A and Kernan Carolyn Kay
Home Financials for this Owner
Home Financials are based on the most recent Mortgage that was taken out on this home.
Original Mortgage
$202,500
Interest Rate
8.13%
Create a Home Valuation Report for This Property
The Home Valuation Report is an in-depth analysis detailing your home's value as well as a comparison with similar homes in the area
Home Values in the Area
Average Home Value in this Area
Purchase History
| Date | Buyer | Sale Price | Title Company |
|---|---|---|---|
| May Todd M | -- | Fidelity Natl Title Co Of Ca | |
| May Todd M | $240,000 | First American Title | |
| Kernan Michael A | $225,000 | American Title Co |
Source: Public Records
Mortgage History
| Date | Status | Borrower | Loan Amount |
|---|---|---|---|
| Open | May Todd M | $440,000 | |
| Closed | May Todd M | $192,000 | |
| Previous Owner | Kernan Michael A | $202,500 |
Source: Public Records
Tax History
| Year | Tax Paid | Tax Assessment Tax Assessment Total Assessment is a certain percentage of the fair market value that is determined by local assessors to be the total taxable value of land and additions on the property. | Land | Improvement |
|---|---|---|---|---|
| 2025 | $3,943 | $376,228 | $94,049 | $282,179 |
| 2024 | $3,943 | $368,852 | $92,205 | $276,647 |
| 2023 | $3,871 | $361,621 | $90,398 | $271,223 |
| 2022 | $3,813 | $354,531 | $88,626 | $265,905 |
| 2021 | $3,761 | $347,581 | $86,889 | $260,692 |
| 2020 | $3,714 | $344,018 | $85,999 | $258,019 |
| 2019 | $3,651 | $337,273 | $84,313 | $252,960 |
| 2018 | $3,559 | $330,660 | $82,660 | $248,000 |
| 2017 | $3,317 | $324,178 | $81,040 | $243,138 |
| 2016 | $3,465 | $317,822 | $79,451 | $238,371 |
| 2015 | $3,347 | $313,049 | $78,258 | $234,791 |
| 2014 | $3,176 | $306,918 | $76,726 | $230,192 |
Source: Public Records
Map
Nearby Homes
- 129 Cerrito Dr
- 104 Whelan Ct
- 103 Rebecca Way
- 147 Rebecca Way
- 430 Flower Dr
- 111 Burrill Dr
- 196 Bittercreek Dr
- 109 Lions Way
- 155 Bittercreek Dr
- 194 Briggs Ranch Dr
- 149 Winterstein Dr
- 141 Winterstein Dr Unit 2
- 141 Sierra Woods Cir
- 136 Rambling Dr
- 29 Dean Way
- 100 Hensey Ct
- 127 McKiernan Dr
- 1375 Quigley Ct
- 101 Coval Ct
- 124 Fargo Way
Your Personal Tour Guide
Ask me questions while you tour the home.