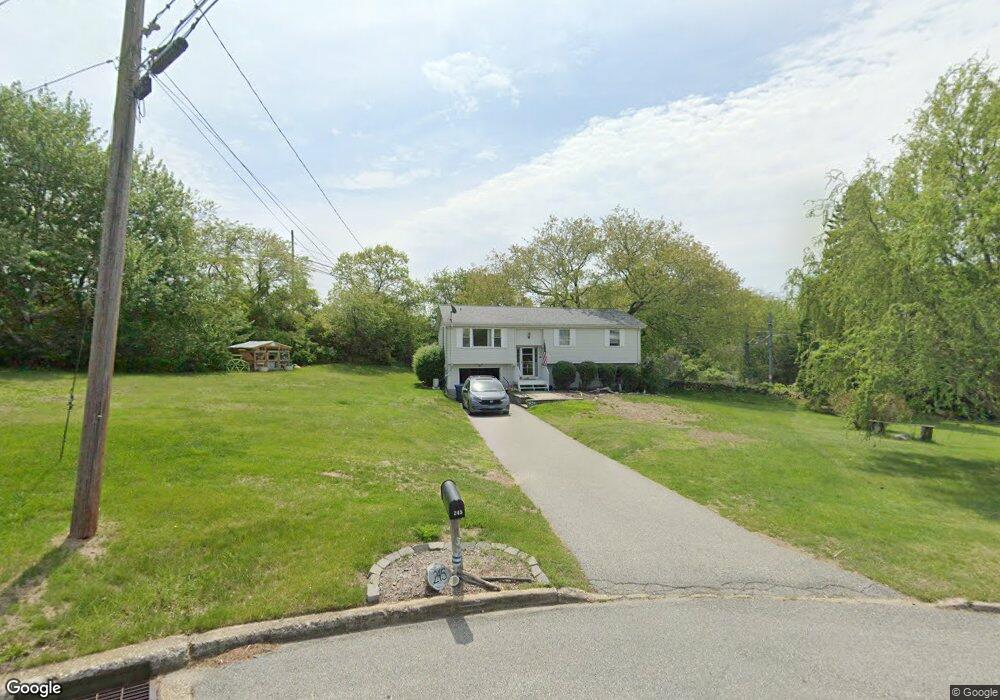
245 Seneca Dr Groton, CT 06340
Noank NeighborhoodEstimated Value: $464,000 - $637,000
3
Beds
2
Baths
1,772
Sq Ft
$300/Sq Ft
Est. Value
About This Home
This home is located at 245 Seneca Dr, Groton, CT 06340 and is currently estimated at $530,870, approximately $299 per square foot. 245 Seneca Dr is a home located in New London County with nearby schools including Groton Middle School and Robert E. Fitch High School.
Ownership History
Date
Name
Owned For
Owner Type
Purchase Details
Closed on
Apr 1, 2010
Sold by
Sharr Sandra A
Bought by
Sexton Michael B and Sexton Patricia A
Current Estimated Value
Home Financials for this Owner
Home Financials are based on the most recent Mortgage that was taken out on this home.
Original Mortgage
$275,811
Outstanding Balance
$183,153
Interest Rate
4.94%
Estimated Equity
$347,717
Create a Home Valuation Report for This Property
The Home Valuation Report is an in-depth analysis detailing your home's value as well as a comparison with similar homes in the area
Home Values in the Area
Average Home Value in this Area
Purchase History
| Date | Buyer | Sale Price | Title Company |
|---|---|---|---|
| Sexton Michael B | $267,000 | -- |
Source: Public Records
Mortgage History
| Date | Status | Borrower | Loan Amount |
|---|---|---|---|
| Open | Sexton Michael B | $275,811 | |
| Previous Owner | Sexton Michael B | $50,000 | |
| Previous Owner | Sexton Michael B | $50,000 | |
| Previous Owner | Sexton Michael B | $97,500 |
Source: Public Records
Tax History
| Year | Tax Paid | Tax Assessment Tax Assessment Total Assessment is a certain percentage of the fair market value that is determined by local assessors to be the total taxable value of land and additions on the property. | Land | Improvement |
|---|---|---|---|---|
| 2025 | $5,826 | $220,850 | $112,658 | $108,192 |
| 2024 | $5,440 | $220,850 | $112,658 | $108,192 |
| 2023 | $5,214 | $220,850 | $66,290 | $154,560 |
| 2022 | $5,108 | $220,850 | $66,290 | $154,560 |
| 2021 | $4,426 | $160,020 | $49,070 | $110,950 |
| 2020 | $4,313 | $160,020 | $49,070 | $110,950 |
| 2019 | $4,117 | $160,020 | $49,070 | $110,950 |
| 2018 | $4,090 | $160,020 | $49,070 | $110,950 |
| 2017 | $4,020 | $160,020 | $49,070 | $110,950 |
| 2016 | $3,984 | $171,570 | $69,440 | $102,130 |
| 2015 | $3,833 | $171,570 | $69,440 | $102,130 |
| 2014 | $3,735 | $171,570 | $69,440 | $102,130 |
Source: Public Records
Map
Nearby Homes
- 49 Noble Ave
- 157 Prospect Hill Rd
- 70 Prospect Hill Rd
- 16 Prospect Hill Rd
- 15 Elm St
- 17 High St
- 37 Sylvan St
- 11 Pearl St
- 19 Pearl St
- 27 Church St
- 224 Neptune Dr
- 28 Money Point Rd
- 19 Money Point Rd
- 255 Capstan Ave
- 315 Judson Ave
- 32 Concord Ct
- 23 Ivy Hill Rd
- 83 Old North Rd
- 151 Ocean View Ave
- 1 Egret Rd