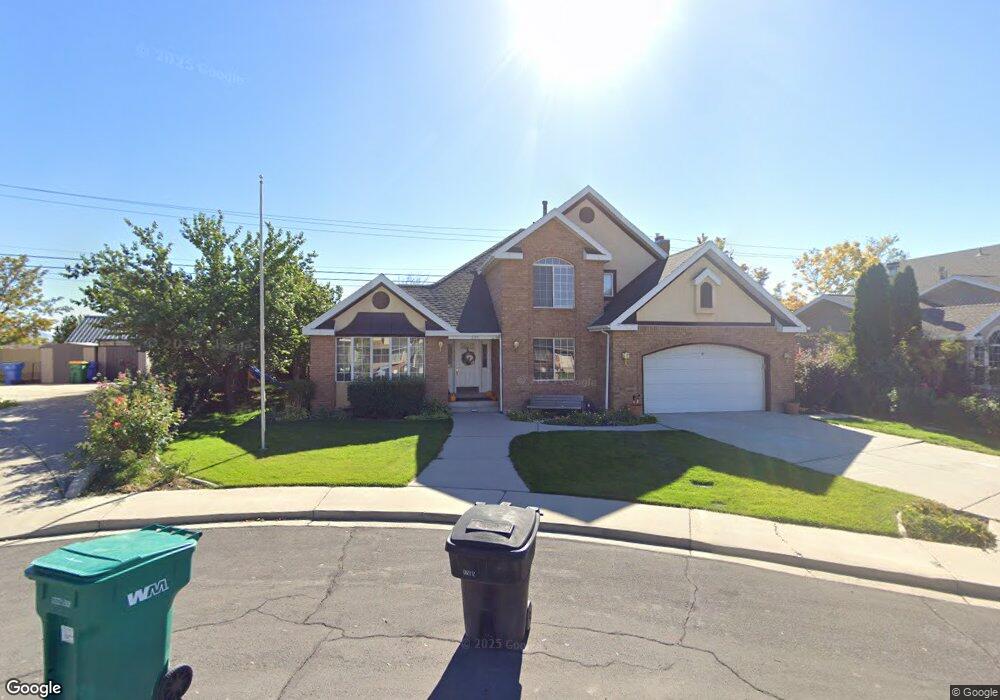
245 W 765 S Orem, UT 84058
Orem South NeighborhoodEstimated Value: $559,000 - $698,000
4
Beds
3
Baths
2,618
Sq Ft
$237/Sq Ft
Est. Value
About This Home
This home is located at 245 W 765 S, Orem, UT 84058 and is currently estimated at $620,130, approximately $236 per square foot. 245 W 765 S is a home located in Utah County with nearby schools including Orem Elementary School, Lakeridge Jr High School, and Mountain View High School.
Ownership History
Date
Name
Owned For
Owner Type
Purchase Details
Closed on
Sep 20, 2016
Sold by
Meservy Joseph Rayman
Bought by
Meservy Joseph Rayman and Meservy Heidi
Current Estimated Value
Home Financials for this Owner
Home Financials are based on the most recent Mortgage that was taken out on this home.
Original Mortgage
$185,000
Interest Rate
3.45%
Mortgage Type
New Conventional
Purchase Details
Closed on
Sep 19, 2016
Sold by
Meservy Rayman David and Meservy Clayson Mary Lois
Bought by
Meservy Joseph Rayman
Home Financials for this Owner
Home Financials are based on the most recent Mortgage that was taken out on this home.
Original Mortgage
$185,000
Interest Rate
3.45%
Mortgage Type
New Conventional
Purchase Details
Closed on
Sep 2, 2005
Sold by
Meservy Iris K
Bought by
Meservy Iris and Iris K Family Trust
Create a Home Valuation Report for This Property
The Home Valuation Report is an in-depth analysis detailing your home's value as well as a comparison with similar homes in the area
Home Values in the Area
Average Home Value in this Area
Purchase History
| Date | Buyer | Sale Price | Title Company |
|---|---|---|---|
| Meservy Joseph Rayman | -- | Eagle Gate Title Ins Agency | |
| Meservy Joseph Rayman | -- | Eagle Gate Title Ins Agency | |
| Meservy Iris | -- | -- |
Source: Public Records
Mortgage History
| Date | Status | Borrower | Loan Amount |
|---|---|---|---|
| Closed | Meservy Joseph Rayman | $185,000 |
Source: Public Records
Tax History
| Year | Tax Paid | Tax Assessment Tax Assessment Total Assessment is a certain percentage of the fair market value that is determined by local assessors to be the total taxable value of land and additions on the property. | Land | Improvement |
|---|---|---|---|---|
| 2025 | $2,706 | $340,230 | -- | -- |
| 2024 | $2,706 | $330,880 | $0 | $0 |
| 2023 | $2,567 | $337,370 | $0 | $0 |
| 2022 | $2,456 | $312,675 | $0 | $0 |
| 2021 | $2,289 | $441,500 | $167,900 | $273,600 |
| 2020 | $2,124 | $402,500 | $134,300 | $268,200 |
| 2019 | $1,990 | $392,200 | $124,000 | $268,200 |
| 2018 | $1,870 | $352,100 | $106,800 | $245,300 |
| 2017 | $1,820 | $183,590 | $0 | $0 |
| 2016 | $1,974 | $183,590 | $0 | $0 |
| 2015 | $1,972 | $173,470 | $0 | $0 |
| 2014 | $1,781 | $155,980 | $0 | $0 |
Source: Public Records
Map
Nearby Homes
- 207 W 800 S
- 308 W 730 S
- 217 W 900 S
- 244 W 1060 S
- 193 W 530 S
- 55 Hanover Dr
- 912 S 100 E
- 87 E 600 S Unit D
- 139 E 800 S
- 1068 S Ellen Cir
- 56 E 1100 S
- 1121 S 50 E
- 114 W 300 S
- 1070 S Orem Blvd Unit 3
- 216 S 400 W
- 570 S 800 West St Unit 15
- 1700 S Sandhill Rd Unit F401
- 520 S 800 W Unit 14
- 506 S 800 West St Unit 13
- 946 S 450 E
Your Personal Tour Guide
Ask me questions while you tour the home.