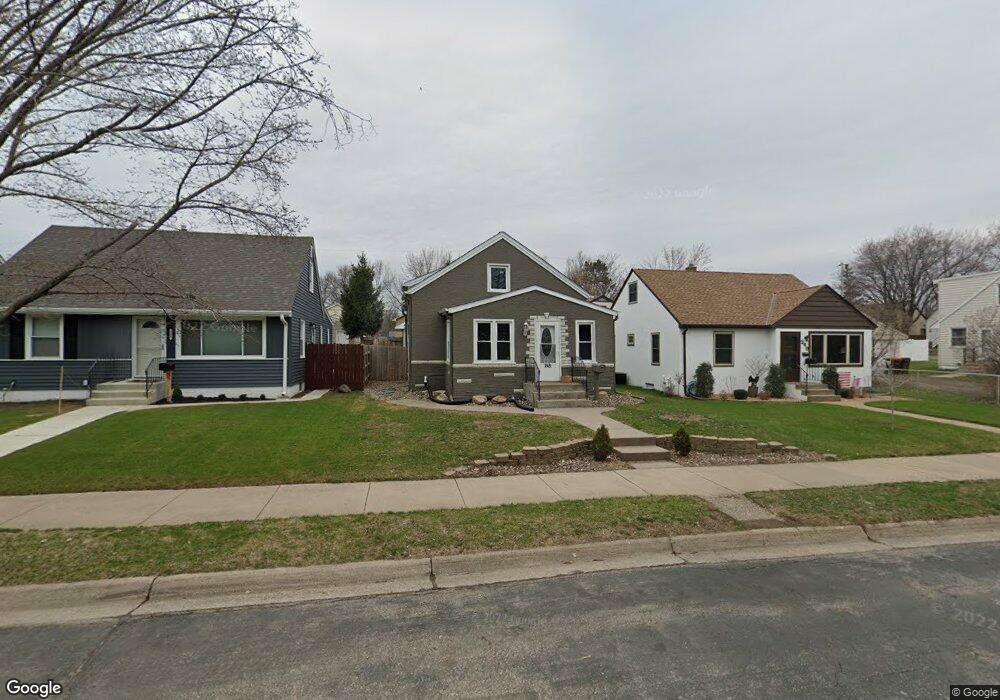
245 W Warburton St South Saint Paul, MN 55075
Estimated Value: $258,000 - $298,000
3
Beds
1
Bath
914
Sq Ft
$307/Sq Ft
Est. Value
About This Home
This home is located at 245 W Warburton St, South Saint Paul, MN 55075 and is currently estimated at $280,869, approximately $307 per square foot. 245 W Warburton St is a home located in Dakota County with nearby schools including Kaposia Education Center Elementary, South St. Paul Secondary, and Discovery Charter School.
Ownership History
Date
Name
Owned For
Owner Type
Purchase Details
Closed on
Jul 26, 2024
Sold by
Lyons Nathanial
Bought by
Lyons Gina and Lyons Gina
Current Estimated Value
Home Financials for this Owner
Home Financials are based on the most recent Mortgage that was taken out on this home.
Original Mortgage
$30,000
Outstanding Balance
$29,666
Interest Rate
6.95%
Mortgage Type
New Conventional
Estimated Equity
$251,203
Purchase Details
Closed on
Aug 30, 2018
Sold by
Jrt Group Llc
Bought by
Lyons Nathaniel D and Lyons Gina L
Home Financials for this Owner
Home Financials are based on the most recent Mortgage that was taken out on this home.
Original Mortgage
$204,000
Interest Rate
4.5%
Mortgage Type
VA
Purchase Details
Closed on
Jul 24, 2017
Sold by
Us Bank Na
Bought by
Jrt Group Llc
Purchase Details
Closed on
Aug 12, 1999
Sold by
Hocking Andrea E
Bought by
Boehmer Brian and Boehmer Mikki
Create a Home Valuation Report for This Property
The Home Valuation Report is an in-depth analysis detailing your home's value as well as a comparison with similar homes in the area
Home Values in the Area
Average Home Value in this Area
Purchase History
| Date | Buyer | Sale Price | Title Company |
|---|---|---|---|
| Lyons Gina | $30,000 | -- | |
| Lyons Nathaniel D | $216,500 | Titlesmart Inc | |
| Jrt Group Llc | $117,600 | None Available | |
| Boehmer Brian | $98,000 | -- |
Source: Public Records
Mortgage History
| Date | Status | Borrower | Loan Amount |
|---|---|---|---|
| Open | Lyons Gina | $30,000 | |
| Previous Owner | Lyons Nathaniel D | $204,000 |
Source: Public Records
Tax History Compared to Growth
Tax History
| Year | Tax Paid | Tax Assessment Tax Assessment Total Assessment is a certain percentage of the fair market value that is determined by local assessors to be the total taxable value of land and additions on the property. | Land | Improvement |
|---|---|---|---|---|
| 2024 | $3,120 | $236,300 | $51,200 | $185,100 |
| 2023 | $3,120 | $235,800 | $51,500 | $184,300 |
| 2022 | $2,372 | $225,300 | $51,500 | $173,800 |
| 2021 | $2,420 | $188,000 | $44,800 | $143,200 |
| 2020 | $2,324 | $187,900 | $42,600 | $145,300 |
| 2019 | $2,041 | $185,500 | $40,600 | $144,900 |
| 2018 | $1,938 | $160,400 | $36,900 | $123,500 |
| 2017 | $1,671 | $148,200 | $35,200 | $113,000 |
| 2016 | $2,106 | $134,700 | $32,000 | $102,700 |
| 2015 | $2,028 | $103,043 | $24,420 | $78,623 |
| 2014 | -- | $102,280 | $24,371 | $77,909 |
| 2013 | -- | $87,565 | $20,496 | $67,069 |
Source: Public Records
Map
Nearby Homes
- 233 Richmond St W
- 151 Park St W
- 235 9th St S
- 100 W Warburton St
- 101 Frost St W
- 928 8th Ave S
- 1127 9th Ave S
- 1215 8th Ave S
- 1436 5th Ave S
- 4970 Boyd Ave
- 5472 Bryce Ave
- 1456 6th Ave S
- 1434 8th Ave S
- 137 South St E
- 533 1st Ave S
- 519 8th Ave S
- 526 9th Ave S
- 454 1st Ave S
- 4898 Bitterman Path Unit 9101
- 454 8th Ave S
- 241 W Warburton St
- 249 W Warburton St
- 239 W Warburton St
- 253 W Warburton St
- 235 W Warburton St
- 253 W Warburton St
- 235 235 Warburton-Street-w
- 235 235 W Warburton St
- 248 Richmond St W
- 244 Richmond St W
- 244 244 Richmond-Street-w
- 244 244 Richmond St W
- 231 W Warburton St
- 252 Richmond St W
- 238 Richmond St W
- 231 231 W Warburton St
- 232 Richmond St W
- 256 Richmond St W
- 225 W Warburton St
- 230 Richmond St W