2450 E Alameda Ave Denver, CO 80209
Belcaro NeighborhoodEstimated Value: $2,020,491 - $2,780,000
4
Beds
5
Baths
3,719
Sq Ft
$644/Sq Ft
Est. Value
About This Home
This home is located at 2450 E Alameda Ave, Denver, CO 80209 and is currently estimated at $2,396,123, approximately $644 per square foot. 2450 E Alameda Ave is a home located in Denver County with nearby schools including Cory Elementary School, Merrill Middle School, and South High School.
Ownership History
Date
Name
Owned For
Owner Type
Purchase Details
Closed on
Dec 12, 2023
Sold by
Judith A Johnson Trust
Bought by
Johnson Judith A and Johnson Edgar R
Current Estimated Value
Purchase Details
Closed on
Dec 23, 2008
Sold by
Johnson R Edgar and Johnson Judith A
Bought by
R Edgar Johnson Trust and Judith A Johnson Trust
Purchase Details
Closed on
Aug 18, 2005
Sold by
Goldstein Henry R and Betson Goldstein Carol L
Bought by
Johnson R Edgar and Johnson Judith A
Purchase Details
Closed on
Sep 16, 1997
Sold by
Kondos George S and Kondos Jean
Bought by
Goldstein Henry R and Betson Goldstein Carol L
Home Financials for this Owner
Home Financials are based on the most recent Mortgage that was taken out on this home.
Original Mortgage
$494,000
Interest Rate
7.37%
Purchase Details
Closed on
Nov 30, 1994
Sold by
L C Fulenwider Inc
Bought by
Kondos George S and Kondos Jean
Create a Home Valuation Report for This Property
The Home Valuation Report is an in-depth analysis detailing your home's value as well as a comparison with similar homes in the area
Home Values in the Area
Average Home Value in this Area
Purchase History
| Date | Buyer | Sale Price | Title Company |
|---|---|---|---|
| Johnson Judith A | -- | None Listed On Document | |
| Johnson Judith A | -- | None Listed On Document | |
| R Edgar Johnson Trust | -- | None Available | |
| Johnson R Edgar | $1,215,000 | Security Title | |
| Goldstein Henry R | $669,000 | Land Title | |
| Kondos George S | $540,174 | Land Title Guarantee Company |
Source: Public Records
Mortgage History
| Date | Status | Borrower | Loan Amount |
|---|---|---|---|
| Previous Owner | Goldstein Henry R | $494,000 |
Source: Public Records
Tax History
| Year | Tax Paid | Tax Assessment Tax Assessment Total Assessment is a certain percentage of the fair market value that is determined by local assessors to be the total taxable value of land and additions on the property. | Land | Improvement |
|---|---|---|---|---|
| 2025 | $9,992 | $153,210 | $57,500 | $57,500 |
| 2024 | $9,992 | $132,860 | $45,500 | $87,360 |
| 2023 | $9,776 | $132,860 | $45,500 | $87,360 |
| 2022 | $7,397 | $99,970 | $51,020 | $48,950 |
| 2021 | $7,141 | $102,850 | $52,490 | $50,360 |
| 2020 | $7,195 | $104,130 | $49,570 | $54,560 |
| 2019 | $6,994 | $104,130 | $49,570 | $54,560 |
| 2018 | $6,342 | $89,180 | $46,980 | $42,200 |
| 2017 | $6,323 | $89,180 | $46,980 | $42,200 |
| 2016 | $6,353 | $77,910 | $32,461 | $45,449 |
| 2015 | $6,087 | $77,910 | $32,461 | $45,449 |
| 2014 | $5,837 | $70,280 | $31,840 | $38,440 |
Source: Public Records
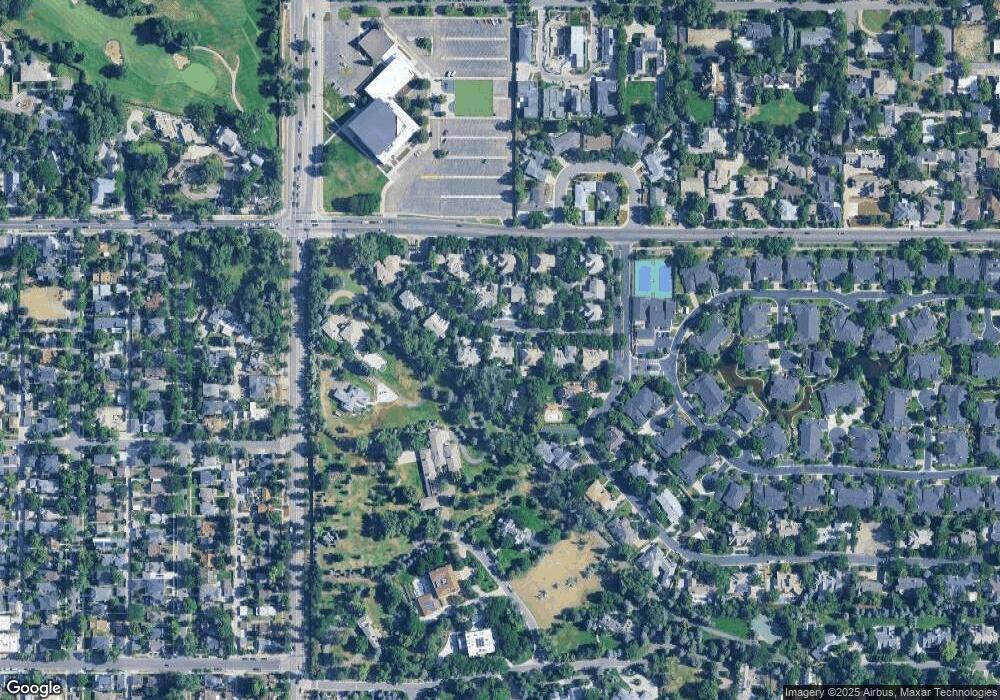
Map
Nearby Homes
- 2600 E Cedar Ave
- 2155 E Alameda Ave
- 414 S Gaylord St
- 2655 E Cedar Ave
- 470 S York St
- 2111 E Alameda Ave
- 100 S University Blvd Unit 7
- 340 S Race St
- 2880 E Cedar Ave
- 2552 E Alameda Ave Unit 92
- 2552 E Alameda Ave Unit 96
- 2552 E Alameda Ave Unit 32
- 2552 E Alameda Ave Unit 31
- 2552 E Alameda Ave Unit 16
- 2552 E Alameda Ave Unit 47
- 2400 E Cherry Creek South Dr Unit 312
- 400 S Race St
- 2500 E Cherry Creek South Dr Unit 217
- 2500 E Cherry Creek South Dr Unit 402
- 457 S Vine St
- 2450 E Alameda Ave
- 2450 E Alameda Ave
- 2450 E Alameda Ave
- 2450 E Alameda Ave
- 2450 E Alameda Ave
- 2450 E Alameda Ave
- 2450 E Alameda Ave
- 2450 E Alameda Ave
- 2450 E Alameda Ave
- 2450 E Alameda Ave
- 2450 E Alameda Ave
- 2450 E Alameda Ave
- 2450 E Alameda Ave
- 2450 E Alameda Ave
- 2450 E Alameda Ave
- 2450 E Alameda Ave
- 2450 E Alameda Ave Unit 4
- 2450 E Alameda Ave Unit 3
- 2450 E Alameda Ave Unit 15
- 2450 E Alameda Ave Unit 8
Your Personal Tour Guide
Ask me questions while you tour the home.