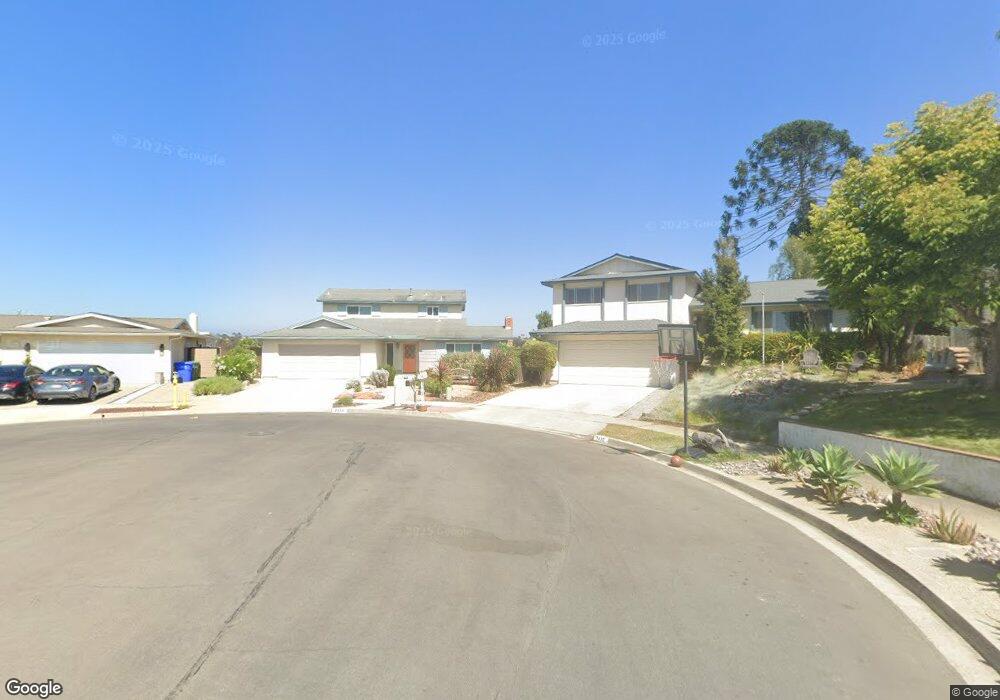
2450 Mark Cir Carlsbad, CA 92010
Tamarack Point NeighborhoodEstimated Value: $1,379,000 - $1,637,000
4
Beds
2
Baths
2,327
Sq Ft
$624/Sq Ft
Est. Value
About This Home
This home is located at 2450 Mark Cir, Carlsbad, CA 92010 and is currently estimated at $1,453,010, approximately $624 per square foot. 2450 Mark Cir is a home located in San Diego County with nearby schools including Hope Elementary School, Calavera Hills Middle, and Carlsbad High School.
Ownership History
Date
Name
Owned For
Owner Type
Purchase Details
Closed on
Feb 22, 2018
Sold by
Cullen Kathryn A
Bought by
Cullen Kathryn Arleen and The Kathryn Arleen Cullen Trus
Current Estimated Value
Purchase Details
Closed on
Jul 29, 2013
Sold by
Condon Thomas P
Bought by
Cullen Kathryn A
Purchase Details
Closed on
Oct 18, 1999
Sold by
Thomas Condon and Kathryn Cullen
Bought by
Condon Thomas P and Cullen Kathryn A
Purchase Details
Closed on
May 12, 1999
Sold by
Condon Thomas and Cullen Kathryn A
Bought by
Condon Thomas P and Cullen Kathryn A
Purchase Details
Closed on
Oct 30, 1997
Sold by
Crossman Jerry L
Bought by
Condon Thomas and Cullen Kathryn
Home Financials for this Owner
Home Financials are based on the most recent Mortgage that was taken out on this home.
Original Mortgage
$204,000
Interest Rate
7%
Create a Home Valuation Report for This Property
The Home Valuation Report is an in-depth analysis detailing your home's value as well as a comparison with similar homes in the area
Home Values in the Area
Average Home Value in this Area
Purchase History
| Date | Buyer | Sale Price | Title Company |
|---|---|---|---|
| Cullen Kathryn Arleen | -- | None Available | |
| Cullen Kathryn A | -- | None Available | |
| Condon Thomas P | -- | -- | |
| Condon Thomas P | -- | -- | |
| Condon Thomas | $255,000 | First American Title Co |
Source: Public Records
Mortgage History
| Date | Status | Borrower | Loan Amount |
|---|---|---|---|
| Previous Owner | Condon Thomas | $204,000 |
Source: Public Records
Tax History Compared to Growth
Tax History
| Year | Tax Paid | Tax Assessment Tax Assessment Total Assessment is a certain percentage of the fair market value that is determined by local assessors to be the total taxable value of land and additions on the property. | Land | Improvement |
|---|---|---|---|---|
| 2025 | $4,588 | $437,749 | $103,482 | $334,267 |
| 2024 | $4,588 | $429,166 | $101,453 | $327,713 |
| 2023 | $4,246 | $391,340 | $99,464 | $291,876 |
| 2022 | $4,180 | $383,667 | $97,514 | $286,153 |
| 2021 | $4,147 | $376,145 | $95,602 | $280,543 |
| 2020 | $4,119 | $372,289 | $94,622 | $277,667 |
| 2019 | $4,060 | $364,990 | $92,767 | $272,223 |
| 2018 | $3,950 | $357,835 | $90,949 | $266,886 |
| 2017 | $3,885 | $350,819 | $89,166 | $261,653 |
| 2016 | $3,731 | $343,941 | $87,418 | $256,523 |
| 2015 | $3,716 | $338,775 | $86,105 | $252,670 |
| 2014 | $3,656 | $332,140 | $84,419 | $247,721 |
Source: Public Records
Map
Nearby Homes
- 3442 Celinda Dr
- 2334 Kimberly Ct
- 2722 Olympia Dr
- 3485 Corvallis St
- 4350 Point Reyes Ct
- 2679 Vancouver St
- 3354 Seacrest Dr
- 3736 Donna Ct
- 4439 Salisbury Dr
- 3920 Holly Brae Ln
- 3721 Donna Ct
- 3306 Donna Dr
- 2195 Basswood Ave
- 3190 Falcon Dr
- 4405 Sierra Morena Ave
- 4459 Dorchester Place
- 4375 Stanford St
- 2591 Regent Rd Unit 52
- 2352 Hosp Way Unit 245
- 2880 Englewood Way
- 2430 Mark Cir
- 2445 Mark Cir
- 3535 Sierra Morena Ave
- 3545 Sierra Morena Ave
- 2420 Mark Cir
- 2435 Mark Cir
- 2425 Stevens Cir
- 3525 Sierra Morena Ave
- 3555 Sierra Morena Ave
- 2415 Stevens Cir
- 2450 Sierra Morena Ave
- 2415 Mark Cir
- 2445 Stevens Cir
- 2430 Sierra Morena Ave
- 3550 Trieste Dr
- 3570 Trieste Dr
- 3580 Trieste Dr
- 2420 Sierra Morena Ave
- 2405 Mark Cir
- 3590 Trieste Dr