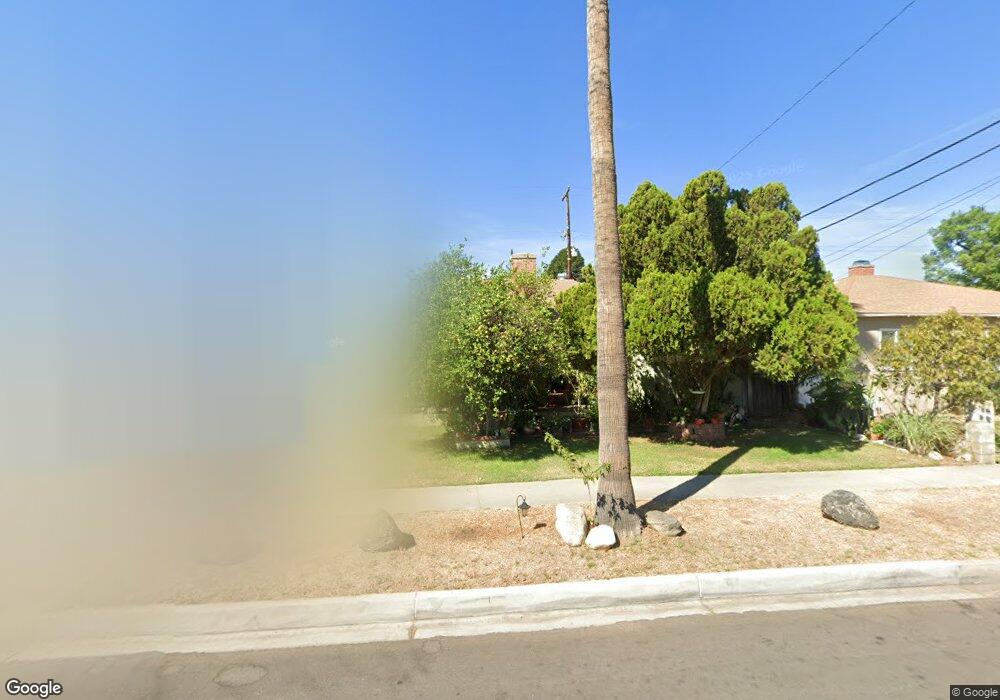
2451 El Sol Ave Altadena, CA 91001
Estimated Value: $673,000 - $955,000
3
Beds
1
Bath
1,157
Sq Ft
$704/Sq Ft
Est. Value
About This Home
This home is located at 2451 El Sol Ave, Altadena, CA 91001 and is currently estimated at $814,223, approximately $703 per square foot. 2451 El Sol Ave is a home located in Los Angeles County with nearby schools including Charles W. Eliot Arts Magnet Academy, John Muir High School, and Odyssey Charter School.
Ownership History
Date
Name
Owned For
Owner Type
Purchase Details
Closed on
Jul 10, 2003
Sold by
Robles Alfredo and Garcia Maria Elvira
Bought by
Robles Alfredo
Current Estimated Value
Home Financials for this Owner
Home Financials are based on the most recent Mortgage that was taken out on this home.
Original Mortgage
$131,600
Outstanding Balance
$55,486
Interest Rate
5.15%
Mortgage Type
Purchase Money Mortgage
Estimated Equity
$758,737
Purchase Details
Closed on
Apr 27, 1998
Sold by
Robles Roberto and Garcia Juan A
Bought by
Robles Alfredo
Home Financials for this Owner
Home Financials are based on the most recent Mortgage that was taken out on this home.
Original Mortgage
$140,592
Interest Rate
7.06%
Mortgage Type
FHA
Purchase Details
Closed on
May 7, 1993
Sold by
Stella Joseph J and Stella Josephine
Bought by
Robles Alfredo
Home Financials for this Owner
Home Financials are based on the most recent Mortgage that was taken out on this home.
Original Mortgage
$146,260
Interest Rate
6.94%
Mortgage Type
FHA
Create a Home Valuation Report for This Property
The Home Valuation Report is an in-depth analysis detailing your home's value as well as a comparison with similar homes in the area
Home Values in the Area
Average Home Value in this Area
Purchase History
| Date | Buyer | Sale Price | Title Company |
|---|---|---|---|
| Robles Alfredo | -- | Old Republic Title Company | |
| Robles Alfredo | -- | Gateway Title | |
| Robles Alfredo | $148,000 | United Title Co |
Source: Public Records
Mortgage History
| Date | Status | Borrower | Loan Amount |
|---|---|---|---|
| Open | Robles Alfredo | $131,600 | |
| Closed | Robles Alfredo | $140,592 | |
| Previous Owner | Robles Alfredo | $146,260 |
Source: Public Records
Tax History
| Year | Tax Paid | Tax Assessment Tax Assessment Total Assessment is a certain percentage of the fair market value that is determined by local assessors to be the total taxable value of land and additions on the property. | Land | Improvement |
|---|---|---|---|---|
| 2025 | $3,245 | $239,110 | $166,353 | $72,757 |
| 2024 | $3,245 | $234,423 | $163,092 | $71,331 |
| 2023 | $3,213 | $229,828 | $159,895 | $69,933 |
| 2022 | $3,109 | $225,322 | $156,760 | $68,562 |
| 2021 | $2,933 | $220,905 | $153,687 | $67,218 |
| 2019 | $2,832 | $214,355 | $149,130 | $65,225 |
| 2018 | $2,786 | $210,153 | $146,206 | $63,947 |
| 2016 | $2,692 | $201,995 | $140,530 | $61,465 |
| 2015 | $2,663 | $198,962 | $138,420 | $60,542 |
| 2014 | $2,620 | $195,066 | $135,709 | $59,357 |
Source: Public Records
Map
Nearby Homes
- 910 Arwin St
- 970 Lehigh St
- 2211 1/8 Casitas Ave
- 2696 Casitas Ave
- 585 Mountain View St
- 494 Alberta St
- 114 116 Mountain View St
- 337 Figueroa Dr
- 309 Acacia St
- 343 W Woodbury Rd
- 2637 N Olive Ave
- 463 Toolen Place
- 1843 Kenneth Way
- 1918 Linda Vista Ave
- 2246 Glenrose Ave
- 2252 Glenrose Ave
- 1525 Inverness Dr
- 1897 Braemar Rd
- 637 W Altadena Dr
- 2191 El Sereno Ave
- 2459 El Sol Ave
- 2443 El Sol Ave
- 2467 El Sol Ave
- 841 Figueroa Dr
- 801 Figueroa Dr
- 2475 El Sol Ave
- 800 Neldome St
- 853 Figueroa Dr
- 849 Figueroa Dr
- 840 Neldome St
- 793 Figueroa Dr
- 2483 El Sol Ave
- 790 Neldome St
- 855 Figueroa Dr
- 859 Figueroa Dr
- 852 Neldome St
- 785 Figueroa Dr
- 840 Figueroa Dr
- 2491 El Sol Ave
- 782 Neldome St
Your Personal Tour Guide
Ask me questions while you tour the home.