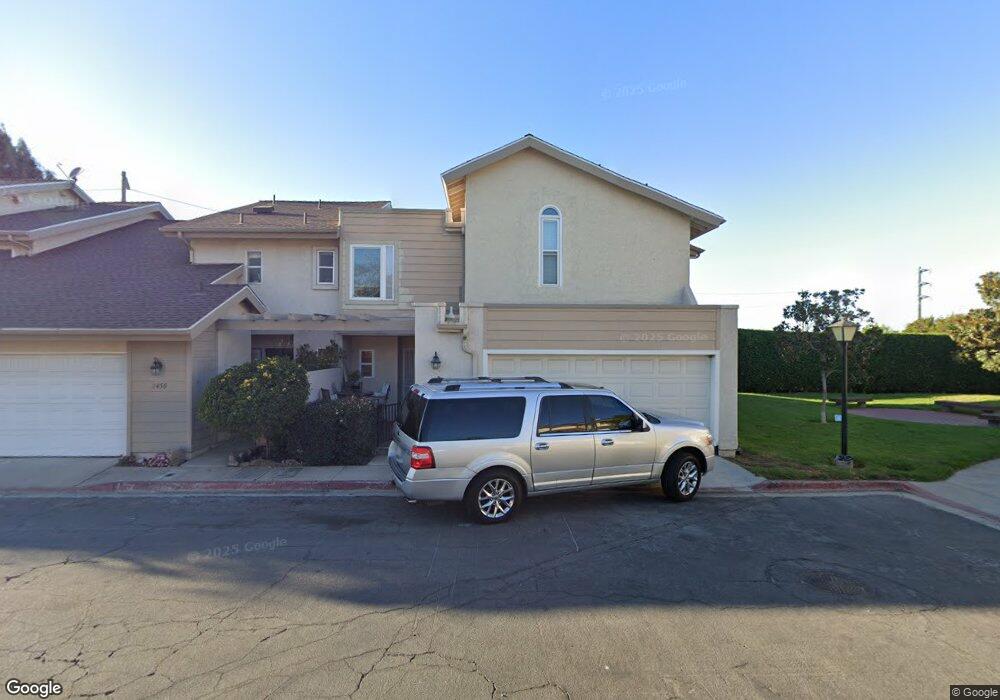
2452 Caminito Venido San Diego, CA 92107
Point Loma Heights NeighborhoodEstimated Value: $942,369 - $1,092,000
3
Beds
3
Baths
1,694
Sq Ft
$595/Sq Ft
Est. Value
About This Home
This home is located at 2452 Caminito Venido, San Diego, CA 92107 and is currently estimated at $1,008,342, approximately $595 per square foot. 2452 Caminito Venido is a home located in San Diego County with nearby schools including Richard Henry Dana Middle School, Ocean Beach Elementary School, and Correia Middle School.
Ownership History
Date
Name
Owned For
Owner Type
Purchase Details
Closed on
Jan 7, 2013
Sold by
Southland Home Mortgage Llc
Bought by
Fabrizio Cecilia S and Stover Ronald
Current Estimated Value
Purchase Details
Closed on
Dec 6, 2012
Sold by
Nelson Daniel C and Nelson Shelley J
Bought by
Southland Home Mortgage Llc
Purchase Details
Closed on
Aug 17, 2006
Sold by
Nelson Shelley J
Bought by
Nelson Daniel C
Purchase Details
Closed on
Jun 4, 1993
Sold by
Rieder Ellen K
Bought by
Nelson Daniel C and Nelson Shelley J
Home Financials for this Owner
Home Financials are based on the most recent Mortgage that was taken out on this home.
Original Mortgage
$91,000
Interest Rate
3.87%
Purchase Details
Closed on
Aug 20, 1992
Purchase Details
Closed on
Oct 11, 1991
Purchase Details
Closed on
May 30, 1986
Create a Home Valuation Report for This Property
The Home Valuation Report is an in-depth analysis detailing your home's value as well as a comparison with similar homes in the area
Home Values in the Area
Average Home Value in this Area
Purchase History
| Date | Buyer | Sale Price | Title Company |
|---|---|---|---|
| Fabrizio Cecilia S | $422,000 | Lawyers Title | |
| Southland Home Mortgage Llc | $395,000 | Accommodation | |
| Nelson Daniel C | -- | None Available | |
| Nelson Daniel C | $192,500 | Chicago Title Company | |
| -- | $204,000 | -- | |
| -- | $211,000 | -- | |
| -- | $132,000 | -- |
Source: Public Records
Mortgage History
| Date | Status | Borrower | Loan Amount |
|---|---|---|---|
| Previous Owner | Nelson Daniel C | $91,000 |
Source: Public Records
Tax History Compared to Growth
Tax History
| Year | Tax Paid | Tax Assessment Tax Assessment Total Assessment is a certain percentage of the fair market value that is determined by local assessors to be the total taxable value of land and additions on the property. | Land | Improvement |
|---|---|---|---|---|
| 2025 | $6,288 | $519,648 | $338,635 | $181,013 |
| 2024 | $6,288 | $509,460 | $331,996 | $177,464 |
| 2023 | $6,150 | $499,472 | $325,487 | $173,985 |
| 2022 | $5,987 | $489,679 | $319,105 | $170,574 |
| 2021 | $5,946 | $480,079 | $312,849 | $167,230 |
| 2020 | $5,874 | $475,158 | $309,642 | $165,516 |
| 2019 | $5,769 | $465,842 | $303,571 | $162,271 |
| 2018 | $5,395 | $456,709 | $297,619 | $159,090 |
| 2017 | $80 | $447,755 | $291,784 | $155,971 |
| 2016 | $5,183 | $438,976 | $286,063 | $152,913 |
| 2015 | $5,107 | $432,384 | $281,767 | $150,617 |
| 2014 | $5,027 | $423,915 | $276,248 | $147,667 |
Source: Public Records
Map
Nearby Homes
- 4021 Caminito Dehesa
- 2373 Caminito Afuera
- 2359 Caminito Agrado
- 2658 Worden St Unit 232
- 4012 Valeta St Unit 304
- 2640 Worden St Unit 207
- 2666 Worden St Unit 8
- 4337-39 Mentone St
- 2284 Caminito Pajarito Unit 147
- 4100 Voltaire St Unit 127
- 4141 Whittier St
- 4363 Temecula St
- 4375 Temecula St Unit 77
- 4225 Whittier St
- 4368 Temecula St Unit 101
- 4380 Temecula St Unit 4
- 2812 Poinsettia Dr
- 4377 Rialto St Unit 1, 2
- 4377 Rialto St Unit 449-867-01-00
- 2187 Catalina Blvd Unit 1
- 2450 Caminito Venido
- 2448 Caminito Venido
- 2456 Caminito Venido
- 2446 Caminito Venido
- 2458 Caminito Venido
- 2461 Caminito Venido
- 2460 Caminito Venido
- 2444 Caminito Venido
- 2463 Caminito Venido
- 2462 Caminito Venido
- 4062 Caminito Dehesa
- 2442 Caminito Venido
- 2465 Caminito Venido
- 4052 Caminito Dehesa
- 2464 Caminito Venido
- 2440 Caminito Venido Unit 1
- 4042 Caminito Dehesa
- 2467 Caminito Venido
- 2466 Caminito Venido
- 4061 Caminito Dehesa