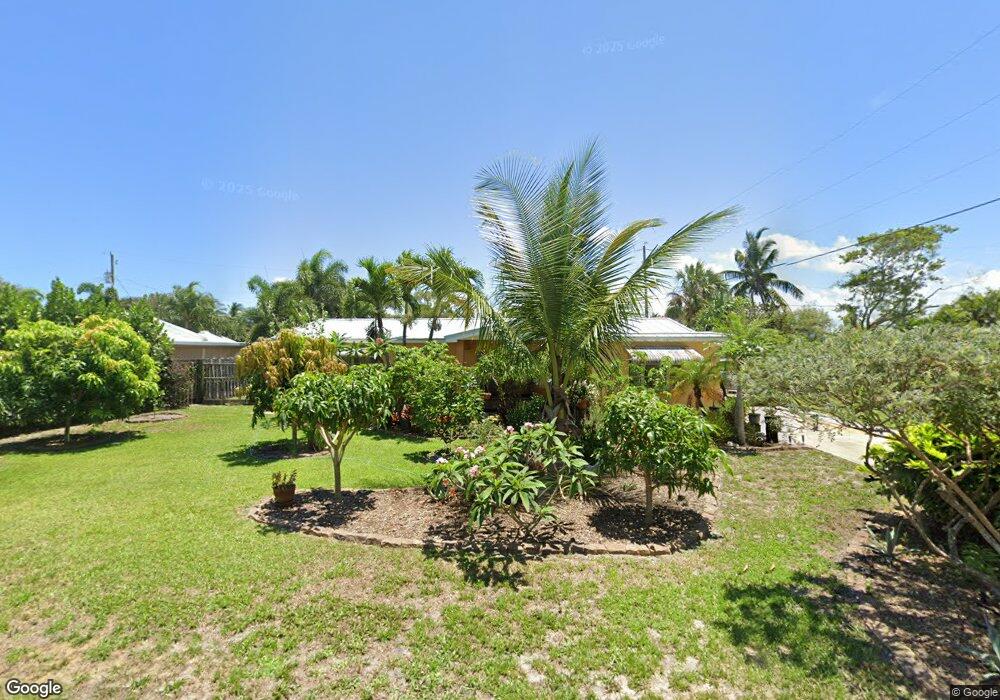
2452 NE Myrtle St Jensen Beach, FL 34957
Estimated Value: $215,000 - $380,177
3
Beds
2
Baths
1,622
Sq Ft
$201/Sq Ft
Est. Value
About This Home
This home is located at 2452 NE Myrtle St, Jensen Beach, FL 34957 and is currently estimated at $325,544, approximately $200 per square foot. 2452 NE Myrtle St is a home located in Martin County with nearby schools including Felix A. Williams Elementary School, Stuart Middle School, and Jensen Beach High School.
Ownership History
Date
Name
Owned For
Owner Type
Purchase Details
Closed on
Dec 29, 2022
Sold by
Donnelly Clifford W
Bought by
Jungwirth Erik George
Current Estimated Value
Home Financials for this Owner
Home Financials are based on the most recent Mortgage that was taken out on this home.
Original Mortgage
$142,373
Outstanding Balance
$137,978
Interest Rate
6.61%
Mortgage Type
FHA
Estimated Equity
$187,566
Purchase Details
Closed on
Aug 29, 2005
Sold by
Rokus Mary Ann
Bought by
Donnelly Clifford W
Home Financials for this Owner
Home Financials are based on the most recent Mortgage that was taken out on this home.
Original Mortgage
$12,000
Interest Rate
5.71%
Mortgage Type
Credit Line Revolving
Purchase Details
Closed on
Jul 22, 1991
Bought by
Donnelly Clifford W
Purchase Details
Closed on
Jan 1, 1901
Bought by
Donnelly Clifford W
Create a Home Valuation Report for This Property
The Home Valuation Report is an in-depth analysis detailing your home's value as well as a comparison with similar homes in the area
Home Values in the Area
Average Home Value in this Area
Purchase History
| Date | Buyer | Sale Price | Title Company |
|---|---|---|---|
| Jungwirth Erik George | $145,000 | Arrow Title Services | |
| Donnelly Clifford W | $240,000 | -- | |
| Donnelly Clifford W | $100 | -- | |
| Donnelly Clifford W | -- | -- |
Source: Public Records
Mortgage History
| Date | Status | Borrower | Loan Amount |
|---|---|---|---|
| Open | Jungwirth Erik George | $142,373 | |
| Previous Owner | Donnelly Clifford W | $12,000 | |
| Previous Owner | Donnelly Clifford W | $180,000 |
Source: Public Records
Tax History Compared to Growth
Tax History
| Year | Tax Paid | Tax Assessment Tax Assessment Total Assessment is a certain percentage of the fair market value that is determined by local assessors to be the total taxable value of land and additions on the property. | Land | Improvement |
|---|---|---|---|---|
| 2025 | $3,840 | $255,067 | -- | -- |
| 2024 | $3,752 | $247,879 | -- | -- |
| 2023 | $3,752 | $240,660 | $240,660 | $105,660 |
| 2022 | $3,842 | $185,940 | $0 | $0 |
| 2021 | $3,418 | $169,037 | $0 | $0 |
| 2020 | $2,999 | $153,670 | $90,000 | $63,670 |
| 2019 | $2,911 | $156,370 | $95,000 | $61,370 |
| 2018 | $2,673 | $144,120 | $85,000 | $59,120 |
| 2017 | $2,030 | $125,760 | $76,000 | $49,760 |
| 2016 | $2,037 | $103,660 | $60,000 | $43,660 |
| 2015 | $1,704 | $91,570 | $50,000 | $41,570 |
| 2014 | $1,704 | $86,290 | $45,000 | $41,290 |
Source: Public Records
Map
Nearby Homes
- 1772 NE 23rd Dr
- 2465 NE Evinrude Cir
- 1906 NE Media Ave
- 1887 NE Media Ave
- 2505 NE Evinrude Cir
- 2694 NE Sewalls Landing Way
- 1395 NE Waveland Ave
- 1280 NE Langford Ln
- 1418 NE Oak Bluff Ln
- 1964 NE Lake Place
- 521 NE Sapphire Way
- 1995 NE River Ct
- 1311 NE Langford Ln
- 12 Oak Hill Way
- 1405 NE Indian River Dr Unit 23
- 1405 NE Indian River Dr Unit 9
- 1405 NE Indian River Dr Unit 22
- 1533 NE Outrigger Landings Dr Unit 205
- 1508 NE Outrigger Landings Dr Unit 310
- 443 NE Pinelake Village Blvd
- 2390 NE Dixie Hwy
- 2461 NE Myrtle St
- 434 S Intercoastal Dr
- 2472 NE Myrtle St
- 2481 NE Myrtle St
- 2425 NE Letitia St
- 2460 NE Marian St
- 2491 NE Myrtle St
- 2492 NE Myrtle St
- 2480 NE Marian St
- 2475 NE Letitia St
- 2439 NE Marian St
- 2500 NE Marian St
- 2495 NE Letitia St
- 2501 NE Myrtle St
- 2502 NE Myrtle St
- 0 NE Dixie Hwy & Arch St St
- 2541 NE Myrtle St
- 2510 NE Marian St
- 2375 NE Dixie Hwy