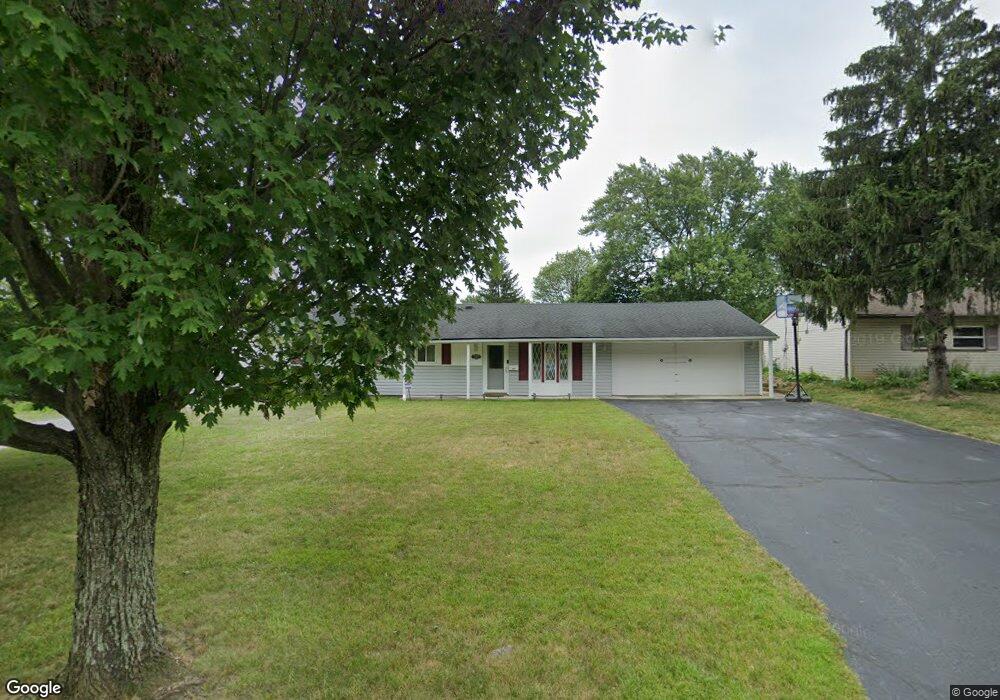
24520 Uppingham Rd Bedford, OH 44146
Estimated Value: $190,436 - $201,000
4
Beds
2
Baths
1,510
Sq Ft
$129/Sq Ft
Est. Value
About This Home
This home is located at 24520 Uppingham Rd, Bedford, OH 44146 and is currently estimated at $194,109, approximately $128 per square foot. 24520 Uppingham Rd is a home located in Cuyahoga County with nearby schools including Heskett Middle School, Bedford High School, and Ohio College Preparatory School.
Ownership History
Date
Name
Owned For
Owner Type
Purchase Details
Closed on
Dec 12, 2000
Sold by
Va
Bought by
Steverson Janet D
Current Estimated Value
Home Financials for this Owner
Home Financials are based on the most recent Mortgage that was taken out on this home.
Original Mortgage
$71,437
Outstanding Balance
$26,515
Interest Rate
7.8%
Estimated Equity
$167,594
Purchase Details
Closed on
Mar 22, 2000
Sold by
Hancock Joseph H
Bought by
Va
Purchase Details
Closed on
Oct 11, 1994
Sold by
Huffman William S
Bought by
Hancock Joseph H
Home Financials for this Owner
Home Financials are based on the most recent Mortgage that was taken out on this home.
Original Mortgage
$84,460
Interest Rate
9%
Mortgage Type
VA
Purchase Details
Closed on
Feb 16, 1982
Sold by
Huffman William S
Bought by
William S Huffman
Purchase Details
Closed on
Nov 18, 1977
Sold by
Clark Robert A and Clark Marian J
Bought by
Huffman William S
Purchase Details
Closed on
Jan 1, 1975
Bought by
Clark Robert A and Clark Marian J
Create a Home Valuation Report for This Property
The Home Valuation Report is an in-depth analysis detailing your home's value as well as a comparison with similar homes in the area
Home Values in the Area
Average Home Value in this Area
Purchase History
| Date | Buyer | Sale Price | Title Company |
|---|---|---|---|
| Steverson Janet D | -- | -- | |
| Va | $70,857 | -- | |
| Hancock Joseph H | $82,000 | -- | |
| William S Huffman | -- | -- | |
| Huffman William S | $36,000 | -- | |
| Clark Robert A | -- | -- |
Source: Public Records
Mortgage History
| Date | Status | Borrower | Loan Amount |
|---|---|---|---|
| Open | Steverson Janet D | $71,437 | |
| Previous Owner | Hancock Joseph H | $84,460 |
Source: Public Records
Tax History Compared to Growth
Tax History
| Year | Tax Paid | Tax Assessment Tax Assessment Total Assessment is a certain percentage of the fair market value that is determined by local assessors to be the total taxable value of land and additions on the property. | Land | Improvement |
|---|---|---|---|---|
| 2024 | $4,141 | $58,100 | $12,320 | $45,780 |
| 2023 | $3,191 | $38,750 | $7,040 | $31,710 |
| 2022 | $2,790 | $38,745 | $7,035 | $31,710 |
| 2021 | $2,760 | $38,750 | $7,040 | $31,710 |
| 2020 | $2,517 | $31,780 | $5,780 | $26,010 |
| 2019 | $2,444 | $90,800 | $16,500 | $74,300 |
| 2018 | $2,557 | $31,780 | $5,780 | $26,010 |
| 2017 | $2,708 | $33,470 | $6,690 | $26,780 |
| 2016 | $2,686 | $33,470 | $6,690 | $26,780 |
| 2015 | $2,552 | $33,470 | $6,690 | $26,780 |
| 2014 | $2,552 | $31,850 | $6,370 | $25,480 |
Source: Public Records
Map
Nearby Homes
- 24485 Uppingham Rd
- 24205 Sherborne Rd
- 6185 Eldridge Blvd
- 6254 Randolph Rd
- 6280 Eldridge Blvd
- 5981 Marra Dr
- 5969 Marra Dr
- 5876 Marra Dr
- 886 Archer Rd
- 758 Taft Ave
- 5832 Bear Creek Dr Unit 5832
- 26339 Bluebird Cove
- 24051 Columbus Rd
- 809 Wellmon St
- 6357 Stonehaven Ln
- 6115 Gailway Dr
- 5756 Daniel Dr
- 706 Archer Rd
- 26100 Columbus Rd
- 5696 Columbia Dr
- 24480 Uppingham Rd
- 24560 Uppingham Rd
- 24525 Eldridge Blvd
- 24440 Uppingham Rd
- 24485 Eldridge Blvd
- 24565 Eldridge Blvd
- 24525 Uppingham Rd
- 24445 Eldridge Blvd
- 24445 Uppingham Rd
- 24400 Uppingham Rd
- 24565 Uppingham Rd
- 24615 Uppingham Rd
- 24405 Eldridge Blvd
- 24605 Uppingham Rd
- 24645 Eldridge Blvd
- 24405 Uppingham Rd
- 24585 Uppingham Rd
- 24360 Uppingham Rd
- 24595 Uppingham Rd
- 24365 Eldridge Blvd