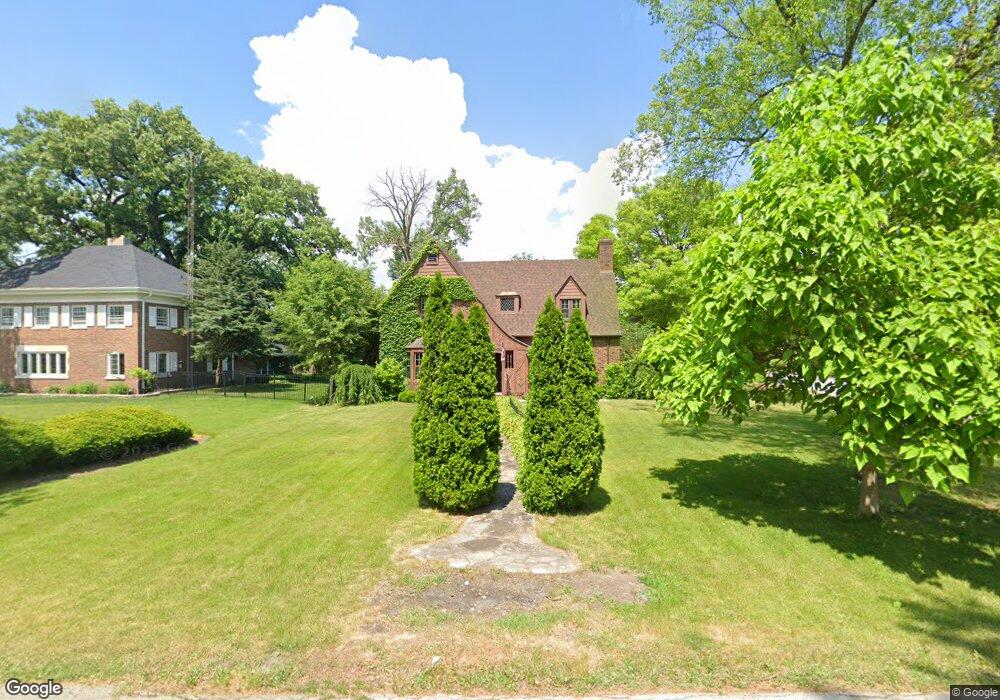
2453 Dougall Rd Joliet, IL 60433
Estimated Value: $363,339 - $465,000
3
Beds
2
Baths
2,400
Sq Ft
$167/Sq Ft
Est. Value
About This Home
This home is located at 2453 Dougall Rd, Joliet, IL 60433 and is currently estimated at $400,085, approximately $166 per square foot. 2453 Dougall Rd is a home located in Will County with nearby schools including Nelson Prairie School, Lincoln Way West, and St. Jude School.
Ownership History
Date
Name
Owned For
Owner Type
Purchase Details
Closed on
Jul 26, 2022
Sold by
Ciba Michael A and Ciba Lauren M
Bought by
Ciba Lauren M
Current Estimated Value
Home Financials for this Owner
Home Financials are based on the most recent Mortgage that was taken out on this home.
Original Mortgage
$120,000
Outstanding Balance
$115,268
Interest Rate
6.13%
Mortgage Type
New Conventional
Estimated Equity
$284,817
Purchase Details
Closed on
Jul 2, 2012
Sold by
Side Investments Inc
Bought by
Ciba Michael A and Ciba Lauren M
Home Financials for this Owner
Home Financials are based on the most recent Mortgage that was taken out on this home.
Original Mortgage
$137,600
Interest Rate
3.37%
Mortgage Type
New Conventional
Purchase Details
Closed on
Jan 26, 2011
Sold by
Keca Nicholas and Estate Of Mary Ann Keca
Bought by
Side Investments Inc
Purchase Details
Closed on
Feb 17, 2000
Sold by
Munch Geraldine V
Bought by
Munch Geraldine V
Create a Home Valuation Report for This Property
The Home Valuation Report is an in-depth analysis detailing your home's value as well as a comparison with similar homes in the area
Home Values in the Area
Average Home Value in this Area
Purchase History
| Date | Buyer | Sale Price | Title Company |
|---|---|---|---|
| Ciba Lauren M | -- | None Listed On Document | |
| Ciba Michael A | $172,000 | Chicago Title Insurance Co | |
| Side Investments Inc | $92,500 | Chicago Title Insurance Co | |
| Keca Nicholas | -- | None Available | |
| Munch Geraldine V | -- | -- |
Source: Public Records
Mortgage History
| Date | Status | Borrower | Loan Amount |
|---|---|---|---|
| Open | Ciba Lauren M | $120,000 | |
| Previous Owner | Ciba Michael A | $137,600 |
Source: Public Records
Tax History Compared to Growth
Tax History
| Year | Tax Paid | Tax Assessment Tax Assessment Total Assessment is a certain percentage of the fair market value that is determined by local assessors to be the total taxable value of land and additions on the property. | Land | Improvement |
|---|---|---|---|---|
| 2024 | $6,126 | $86,292 | $26,918 | $59,374 |
| 2023 | $6,126 | $78,662 | $24,538 | $54,124 |
| 2022 | $5,544 | $72,466 | $22,605 | $49,861 |
| 2021 | $5,252 | $68,152 | $21,259 | $46,893 |
| 2020 | $5,095 | $65,720 | $20,500 | $45,220 |
| 2019 | $4,867 | $63,682 | $19,864 | $43,818 |
| 2018 | $4,746 | $61,488 | $19,180 | $42,308 |
| 2017 | $4,499 | $59,721 | $18,629 | $41,092 |
| 2016 | $4,361 | $58,122 | $18,130 | $39,992 |
| 2015 | $4,187 | $56,292 | $17,559 | $38,733 |
| 2014 | $4,187 | $55,597 | $17,342 | $38,255 |
| 2013 | $4,187 | $56,347 | $17,576 | $38,771 |
Source: Public Records
Map
Nearby Homes
- 200 Montieth St
- 2202 E Washington St
- 450 Kingston Dr
- 2116 Hanover St
- 2834 Sharon Dr
- 519 Kingston Dr
- 1 NE Circle Dr
- 309 SE Circle Dr
- 137 Independence Ave
- 2208 Fiesta Dr
- 2412 Fleetwood Dr
- 2417 Fleetwood Dr
- 2202 Tamarack Dr
- 120 Anderson Ave
- 2102 Tamarack Dr
- 402 Miami St
- 2 Peale St
- 4 Peale St
- 937 Saddle Ridge Dr
- 2602 Timber Springs Dr
- 2445 Dougall Rd
- 2501 Dougall Rd
- 2470 E Cass St
- 2441 Dougall Rd
- 2468 E Cass St
- 2505 Dougall Rd
- 2460 Dougall Rd
- 360 Oakdale Rd
- 2456 Dougall Rd
- 2466 E Cass St
- 2500 Dougall Rd
- 2433 Dougall Rd
- 2452 Dougall Rd
- 2506 Dougall Rd
- 2502 E Cass St
- 2462 E Cass St
- 2448 Dougall Rd
- 2457 Erskine Rd
- 2513 Dougall Rd
- 2429 Dougall Rd