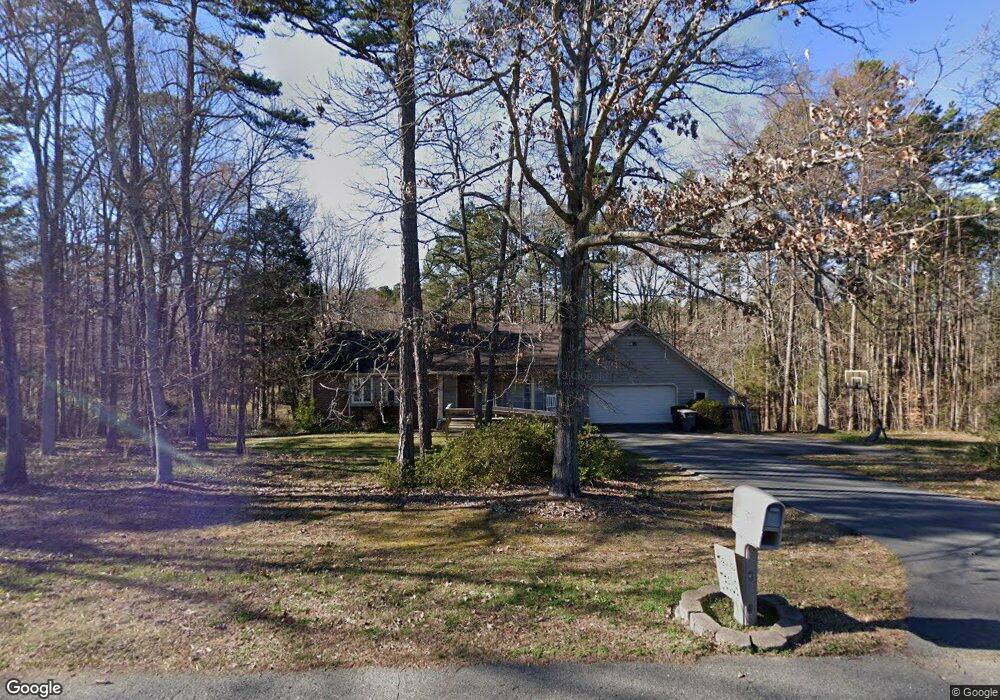
2453 Windingbrook Dr Kannapolis, NC 28083
Estimated Value: $431,000 - $498,203
5
Beds
3
Baths
3,643
Sq Ft
$132/Sq Ft
Est. Value
About This Home
This home is located at 2453 Windingbrook Dr, Kannapolis, NC 28083 and is currently estimated at $480,551, approximately $131 per square foot. 2453 Windingbrook Dr is a home located in Cabarrus County with nearby schools including Forest Park Elementary School, Kannapolis Middle, and A.L. Brown High School.
Ownership History
Date
Name
Owned For
Owner Type
Purchase Details
Closed on
Apr 24, 2015
Sold by
Lowder Eric M and Lowder Lorie H
Bought by
Lopez David M and Lopez Gina L
Current Estimated Value
Home Financials for this Owner
Home Financials are based on the most recent Mortgage that was taken out on this home.
Original Mortgage
$223,850
Outstanding Balance
$173,135
Interest Rate
3.87%
Mortgage Type
FHA
Estimated Equity
$307,416
Purchase Details
Closed on
May 31, 2000
Sold by
Hunt Robert D and Hunt Gwenda N
Bought by
Lowder Eric N and Lowder Lorie H
Home Financials for this Owner
Home Financials are based on the most recent Mortgage that was taken out on this home.
Original Mortgage
$158,400
Interest Rate
8.14%
Purchase Details
Closed on
Mar 1, 1996
Bought by
Hunt Robert D and Wf Gwenda N
Purchase Details
Closed on
May 1, 1994
Purchase Details
Closed on
Feb 1, 1979
Create a Home Valuation Report for This Property
The Home Valuation Report is an in-depth analysis detailing your home's value as well as a comparison with similar homes in the area
Home Values in the Area
Average Home Value in this Area
Purchase History
| Date | Buyer | Sale Price | Title Company |
|---|---|---|---|
| Lopez David M | $240,000 | None Available | |
| Lowder Eric N | $198,000 | -- | |
| Hunt Robert D | $145,000 | -- | |
| -- | $130,000 | -- | |
| -- | $33,000 | -- |
Source: Public Records
Mortgage History
| Date | Status | Borrower | Loan Amount |
|---|---|---|---|
| Open | Lopez David M | $223,850 | |
| Previous Owner | Lowder Eric N | $158,400 |
Source: Public Records
Tax History
| Year | Tax Paid | Tax Assessment Tax Assessment Total Assessment is a certain percentage of the fair market value that is determined by local assessors to be the total taxable value of land and additions on the property. | Land | Improvement |
|---|---|---|---|---|
| 2025 | $5,249 | $462,270 | $100,000 | $362,270 |
| 2024 | $5,249 | $462,270 | $100,000 | $362,270 |
| 2023 | $3,803 | $277,610 | $56,000 | $221,610 |
| 2022 | $3,803 | $277,610 | $56,000 | $221,610 |
| 2021 | $3,803 | $277,610 | $56,000 | $221,610 |
| 2020 | $3,803 | $277,610 | $56,000 | $221,610 |
| 2019 | $3,255 | $237,570 | $41,000 | $196,570 |
| 2018 | $3,207 | $237,570 | $41,000 | $196,570 |
| 2017 | $3,160 | $237,570 | $41,000 | $196,570 |
| 2016 | $3,160 | $226,100 | $50,000 | $176,100 |
| 2015 | $2,849 | $226,100 | $50,000 | $176,100 |
| 2014 | $2,849 | $226,100 | $50,000 | $176,100 |
Source: Public Records
Map
Nearby Homes
- 2990 Dale Earnhardt Blvd
- 2458 Saguaro Ln
- 2271 Knowles St
- 2485 Acadia Ct
- 915 Harbour View Cove NE
- 304 Athens Hills Place
- 2495 Centergrove Rd
- 1838 Summit Ridge Ln
- 2640 Centergrove Rd
- 1655 Garnett St
- 1365 Eagle Claw Dr
- 1768 Concord Lake Rd
- 2882 Centergrove Rd
- 307 S Little Texas Rd
- 1699 Mission Oaks St
- 2124 Clear Brook Dr
- 00 Dixie Dr
- 1010 A-B Tennessee St
- 2020 Quill Ct
- 2203 Florida Ave
- 2445 Windingbrook Dr
- 2452 Windingbrook Dr
- 912 Redleaf Rd
- 2448 Windingbrook Dr
- 2456 Windingbrook Dr
- 2458 Windingbrook Dr
- 2463 Winding Brook Dr
- 2452 Forrestbrook Dr
- 2433 Windingbrook Dr
- 2446 Forrestbrook Dr
- 2438 Windingbrook Dr
- 909 Redleaf Rd
- 2472 Windingbrook Dr
- 2406 Forrestbrook Dr
- 2410 Forrestbrook Dr
- 2406 Forrestbrook Dr
- 2430 Forrestbrook Dr
- 2436 Windingbrook Dr
- 948 Brushwood Ave
- 912 Brushwood Ave
Your Personal Tour Guide
Ask me questions while you tour the home.