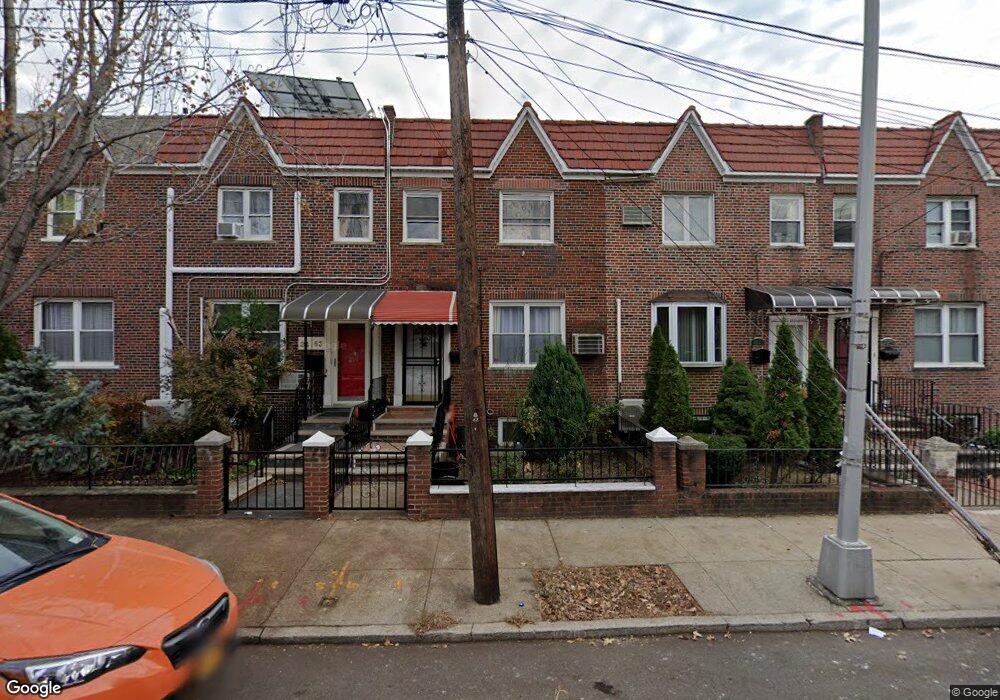
2455 23rd St Astoria, NY 11102
Ditmars Steinway NeighborhoodEstimated Value: $1,087,000 - $1,425,000
--
Bed
--
Bath
1,224
Sq Ft
$994/Sq Ft
Est. Value
About This Home
This home is located at 2455 23rd St, Astoria, NY 11102 and is currently estimated at $1,216,797, approximately $994 per square foot. 2455 23rd St is a home located in Queens County with nearby schools including P.S. 122 Mamie Fay, Is 141 The Steinway, and Long Island City High School.
Ownership History
Date
Name
Owned For
Owner Type
Purchase Details
Closed on
Sep 21, 2017
Sold by
Mesia Lilia R
Bought by
Lilia R Mesia Living Trust and Lilia R Mesia Trustee
Current Estimated Value
Purchase Details
Closed on
Jun 14, 2007
Sold by
Mesia Augusto
Bought by
Mesia Lilia R
Home Financials for this Owner
Home Financials are based on the most recent Mortgage that was taken out on this home.
Original Mortgage
$350,000
Interest Rate
6.24%
Mortgage Type
Purchase Money Mortgage
Purchase Details
Closed on
Nov 21, 2001
Sold by
Dela Cotera Marcelino and De La Cotera Elena Mart
Bought by
Mesia Augusto F and Mesia Lilia R
Home Financials for this Owner
Home Financials are based on the most recent Mortgage that was taken out on this home.
Original Mortgage
$184,000
Interest Rate
6.54%
Create a Home Valuation Report for This Property
The Home Valuation Report is an in-depth analysis detailing your home's value as well as a comparison with similar homes in the area
Home Values in the Area
Average Home Value in this Area
Purchase History
| Date | Buyer | Sale Price | Title Company |
|---|---|---|---|
| Lilia R Mesia Living Trust | -- | -- | |
| Lilia R Mesia Living Trust | -- | -- | |
| Mesia Lilia R | $228,148 | -- | |
| Mesia Lilia R | $228,148 | -- | |
| Mesia Augusto F | -- | -- | |
| Mesia Augusto F | -- | -- |
Source: Public Records
Mortgage History
| Date | Status | Borrower | Loan Amount |
|---|---|---|---|
| Previous Owner | Mesia Lilia R | $350,000 | |
| Previous Owner | Mesia Augusto F | $184,000 |
Source: Public Records
Tax History Compared to Growth
Tax History
| Year | Tax Paid | Tax Assessment Tax Assessment Total Assessment is a certain percentage of the fair market value that is determined by local assessors to be the total taxable value of land and additions on the property. | Land | Improvement |
|---|---|---|---|---|
| 2025 | $8,396 | $44,309 | $6,970 | $37,339 |
| 2024 | $8,396 | $41,803 | $6,736 | $35,067 |
| 2023 | $8,116 | $40,409 | $7,186 | $33,223 |
| 2022 | $8,067 | $70,560 | $11,940 | $58,620 |
| 2021 | $8,237 | $63,960 | $11,940 | $52,020 |
| 2020 | $7,816 | $57,600 | $11,940 | $45,660 |
| 2019 | $7,287 | $59,040 | $11,940 | $47,100 |
| 2018 | $6,864 | $33,674 | $7,572 | $26,102 |
| 2017 | $6,864 | $33,674 | $8,293 | $25,381 |
| 2016 | $6,520 | $33,674 | $8,293 | $25,381 |
| 2015 | $3,832 | $30,770 | $9,202 | $21,568 |
| 2014 | $3,832 | $29,030 | $9,205 | $19,825 |
Source: Public Records
Map
Nearby Homes
- 23-05 24th Ave Unit 3-B
- 19-19 24th Ave Unit L102
- 23-58 23rd St
- 2120 23rd Dr
- 25-14 Crescent St
- 25-35 Crescent St
- 26-08 24th Ave
- 1916 23rd Rd
- 18-21 26th Ave
- 14-28 Astoria Park S
- 18-21 26th Rd
- 26-19 14th Place
- 21-12 22nd Dr Unit HOUSE
- 25-01 23rd Ave
- 25-40 Shore Blvd Unit 3
- 25-40 Shore Blvd Unit 17-K
- 25-40 Shore Blvd Unit 2F
- 25-40 Shore Blvd Unit 2
- 25-40 Shore Blvd Unit 4-S
- 28-12 Astoria Blvd