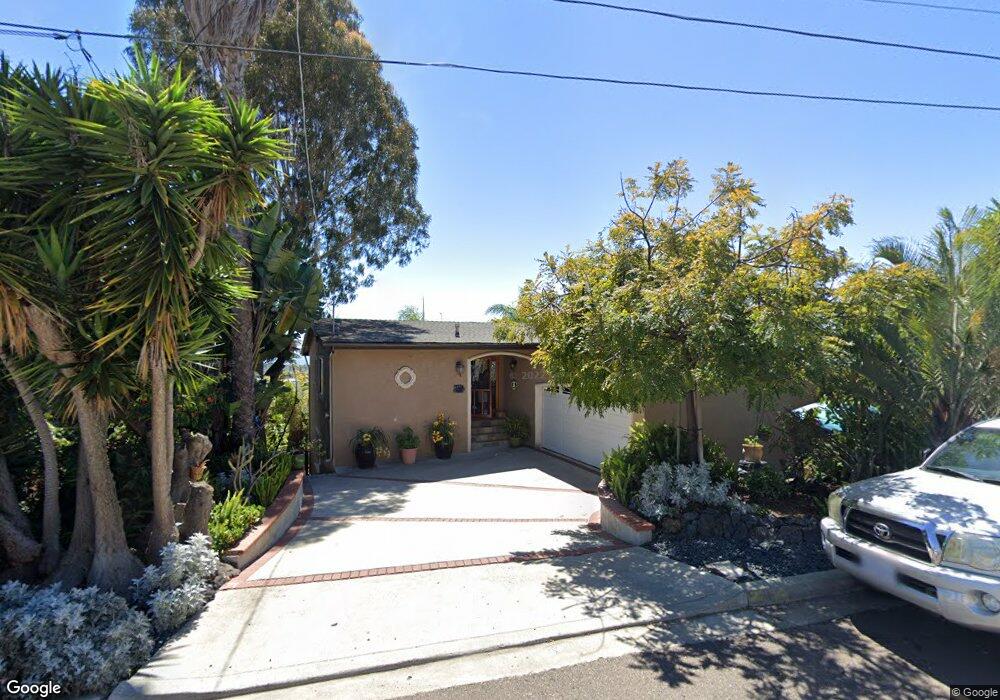
2455 Aster St San Diego, CA 92109
Pacific Beach NeighborhoodEstimated Value: $1,644,200 - $1,882,000
3
Beds
2
Baths
1,751
Sq Ft
$1,006/Sq Ft
Est. Value
About This Home
This home is located at 2455 Aster St, San Diego, CA 92109 and is currently estimated at $1,761,050, approximately $1,005 per square foot. 2455 Aster St is a home located in San Diego County with nearby schools including Sessions Elementary School, Pacific Beach Middle, and Mission Bay High School.
Ownership History
Date
Name
Owned For
Owner Type
Purchase Details
Closed on
Nov 16, 2009
Sold by
Granger David J and Granger Vivian K
Bought by
Granger David J and Granger Vivian K
Current Estimated Value
Home Financials for this Owner
Home Financials are based on the most recent Mortgage that was taken out on this home.
Original Mortgage
$250,000
Interest Rate
4.44%
Mortgage Type
New Conventional
Purchase Details
Closed on
Oct 19, 2009
Sold by
The Granger Family Trust and Granger David J
Bought by
Granger David J and Granger Vivian K
Home Financials for this Owner
Home Financials are based on the most recent Mortgage that was taken out on this home.
Original Mortgage
$250,000
Interest Rate
4.44%
Mortgage Type
New Conventional
Purchase Details
Closed on
Aug 2, 1998
Sold by
Granger David J and Granger Vivian K
Bought by
Granger David J and Granger Vivian K
Purchase Details
Closed on
Oct 3, 1988
Purchase Details
Closed on
Sep 22, 1987
Purchase Details
Closed on
Oct 31, 1986
Purchase Details
Closed on
Jan 14, 1983
Create a Home Valuation Report for This Property
The Home Valuation Report is an in-depth analysis detailing your home's value as well as a comparison with similar homes in the area
Home Values in the Area
Average Home Value in this Area
Purchase History
| Date | Buyer | Sale Price | Title Company |
|---|---|---|---|
| Granger David J | -- | None Available | |
| Granger David J | -- | Chicago Title Company | |
| Granger David J | -- | -- | |
| -- | $325,000 | -- | |
| -- | $230,000 | -- | |
| -- | $230,000 | -- | |
| -- | $232,000 | -- |
Source: Public Records
Mortgage History
| Date | Status | Borrower | Loan Amount |
|---|---|---|---|
| Closed | Granger David J | $250,000 |
Source: Public Records
Tax History Compared to Growth
Tax History
| Year | Tax Paid | Tax Assessment Tax Assessment Total Assessment is a certain percentage of the fair market value that is determined by local assessors to be the total taxable value of land and additions on the property. | Land | Improvement |
|---|---|---|---|---|
| 2025 | $7,292 | $609,858 | $379,528 | $230,330 |
| 2024 | $7,292 | $597,901 | $372,087 | $225,814 |
| 2023 | $7,129 | $586,179 | $364,792 | $221,387 |
| 2022 | $6,938 | $574,687 | $357,640 | $217,047 |
| 2021 | $6,889 | $563,420 | $350,628 | $212,792 |
| 2020 | $6,805 | $557,644 | $347,033 | $210,611 |
| 2019 | $6,682 | $546,711 | $340,229 | $206,482 |
| 2018 | $6,246 | $535,992 | $333,558 | $202,434 |
| 2017 | $6,096 | $525,483 | $327,018 | $198,465 |
| 2016 | $5,997 | $515,180 | $320,606 | $194,574 |
| 2015 | $5,908 | $507,443 | $315,791 | $191,652 |
| 2014 | $5,813 | $497,504 | $309,606 | $187,898 |
Source: Public Records
Map
Nearby Homes
- 2515 Geranium St
- 2481 La Marque St
- 2522 Chalcedony St
- 2315 Geranium St
- 2318 Chalcedony St
- 4647 Pico St Unit 205
- 2609 Pico Place Unit 127
- 2128 Missouri St
- 2730 Garnet Ave Unit 15 & 16
- 4750 Noyes St Unit 110
- 2104 Crownhill Rd
- 4730 Noyes St Unit 106
- 5227 Middleton Rd
- 2669 Magnolia Ave
- 5259 Pacifica Dr
- 1978 Beryl St
- 4470 Bond St
- 2020 Diamond St Unit 12
- 1981 Wilbur Ave
- 2002 Missouri St Unit 6
- 2447 Aster St
- 2475 Aster St
- 2464 Geranium St
- 2474 Geranium St
- 2437 Aster St
- 2454 Geranium St
- 4904 Randall St
- 2463 Wilbur Ave
- 2474 Aster St
- 2445 Wilbur Ave
- 2495 Aster St
- 0 Aster Unit 15
- 2425 Aster St
- 2440 Geranium St
- 2443 Wilbur Ave
- 2481 Wilbur Ave
- 4915 Quincy St
- 2430 Geranium St
- 4921 Quincy St
- 2491 Wilbur Ave