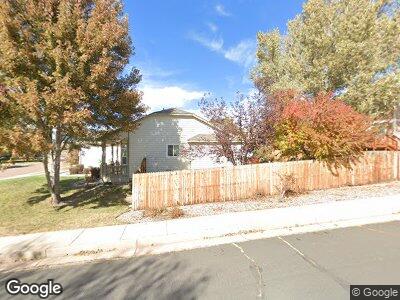
2455 Haystack Dr Colorado Springs, CO 80922
Springs Ranch NeighborhoodEstimated Value: $418,965 - $447,000
3
Beds
3
Baths
1,248
Sq Ft
$350/Sq Ft
Est. Value
About This Home
This home is located at 2455 Haystack Dr, Colorado Springs, CO 80922 and is currently estimated at $437,241, approximately $350 per square foot. 2455 Haystack Dr is a home located in El Paso County with nearby schools including Remington Elementary School, Horizon Middle School, and Sand Creek High School.
Ownership History
Date
Name
Owned For
Owner Type
Purchase Details
Closed on
Dec 11, 2023
Sold by
Low Denise L
Bought by
Low Living Trust and Low
Current Estimated Value
Purchase Details
Closed on
Sep 12, 2011
Sold by
Mosley Sharon
Bought by
Low Denise L
Home Financials for this Owner
Home Financials are based on the most recent Mortgage that was taken out on this home.
Original Mortgage
$181,900
Interest Rate
4.58%
Mortgage Type
VA
Purchase Details
Closed on
May 9, 2006
Sold by
Mosley Sharon
Bought by
Mosley Sharon
Purchase Details
Closed on
Jan 26, 2006
Sold by
Melton Sharon
Bought by
Mosley Sharon
Purchase Details
Closed on
Mar 1, 1995
Sold by
Watt Residential Partners
Bought by
Mosley Sharon Melton and Estate Of Ruth A Ramminger
Purchase Details
Closed on
Apr 1, 1993
Bought by
Low Denise L
Purchase Details
Closed on
Nov 21, 1990
Bought by
Low Denise L
Create a Home Valuation Report for This Property
The Home Valuation Report is an in-depth analysis detailing your home's value as well as a comparison with similar homes in the area
Home Values in the Area
Average Home Value in this Area
Purchase History
| Date | Buyer | Sale Price | Title Company |
|---|---|---|---|
| Low Living Trust | -- | None Listed On Document | |
| Low Denise L | $181,900 | Fidelity National Title Insu | |
| Mosley Sharon | -- | None Available | |
| Mosley Sharon | -- | None Available | |
| Mosley Sharon Melton | $119,195 | -- | |
| Low Denise L | $4,555,000 | -- | |
| Low Denise L | -- | -- |
Source: Public Records
Mortgage History
| Date | Status | Borrower | Loan Amount |
|---|---|---|---|
| Previous Owner | Low Denise L | $139,950 | |
| Previous Owner | Low Denise L | $181,900 |
Source: Public Records
Tax History Compared to Growth
Tax History
| Year | Tax Paid | Tax Assessment Tax Assessment Total Assessment is a certain percentage of the fair market value that is determined by local assessors to be the total taxable value of land and additions on the property. | Land | Improvement |
|---|---|---|---|---|
| 2024 | $1,057 | $30,140 | $4,620 | $25,520 |
| 2023 | $1,057 | $30,140 | $4,620 | $25,520 |
| 2022 | $844 | $21,420 | $4,170 | $17,250 |
| 2021 | $1,301 | $22,030 | $4,290 | $17,740 |
| 2020 | $1,166 | $19,500 | $3,580 | $15,920 |
| 2019 | $1,153 | $19,500 | $3,580 | $15,920 |
| 2018 | $939 | $15,570 | $3,020 | $12,550 |
| 2017 | $944 | $15,570 | $3,020 | $12,550 |
| 2016 | $953 | $15,490 | $2,950 | $12,540 |
| 2015 | $954 | $15,490 | $2,950 | $12,540 |
| 2014 | $909 | $14,470 | $2,790 | $11,680 |
Source: Public Records
Map
Nearby Homes
- 6555 Turkey Tracks Rd
- 2970 Leoti Dr
- 2860 Richmond Dr
- 3130 Haystack Dr
- 2870 Harrisburg Way
- 3062 Pony Tracks Dr
- 3052 Curly Grove
- 660 Piros Dr
- 3064 Curly Grove
- 2880 Frazier Ln
- 6292 Chantilly Place
- 3065 Curly Grove
- 6268 Chantilly Place
- 3071 Curly Grove
- 3077 Curly Grove
- 6659 Bismark Rd
- 6382 Zermatt Dr
- 3323 Evening Breeze Dr
- 3327 Evening Breeze Dr
- 3511 Greenways Main Blvd
- 2455 Haystack Dr
- 2925 Muleshoe Dr
- 1065 Piros Dr
- 1055 Piros Dr
- 2935 Muleshoe Dr
- 2450 Haystack Dr
- 2475 Haystack Dr
- 2440 Haystack Dr
- 2460 Haystack Dr
- 1045 Piros Dr
- 2920 Mule Shoe Dr
- 2920 Muleshoe Dr
- 2430 Haystack Dr
- 2945 Muleshoe Dr
- 2470 Haystack Dr
- 2930 Muleshoe Dr
- 1025 Piros Dr
- 2480 Haystack Dr
- 2955 Muleshoe Dr
- 6460 Pitchfork Dr