2455 Riverside Dr Port Huron, MI 48060
Estimated Value: $197,000 - $247,000
3
Beds
2
Baths
1,149
Sq Ft
$195/Sq Ft
Est. Value
About This Home
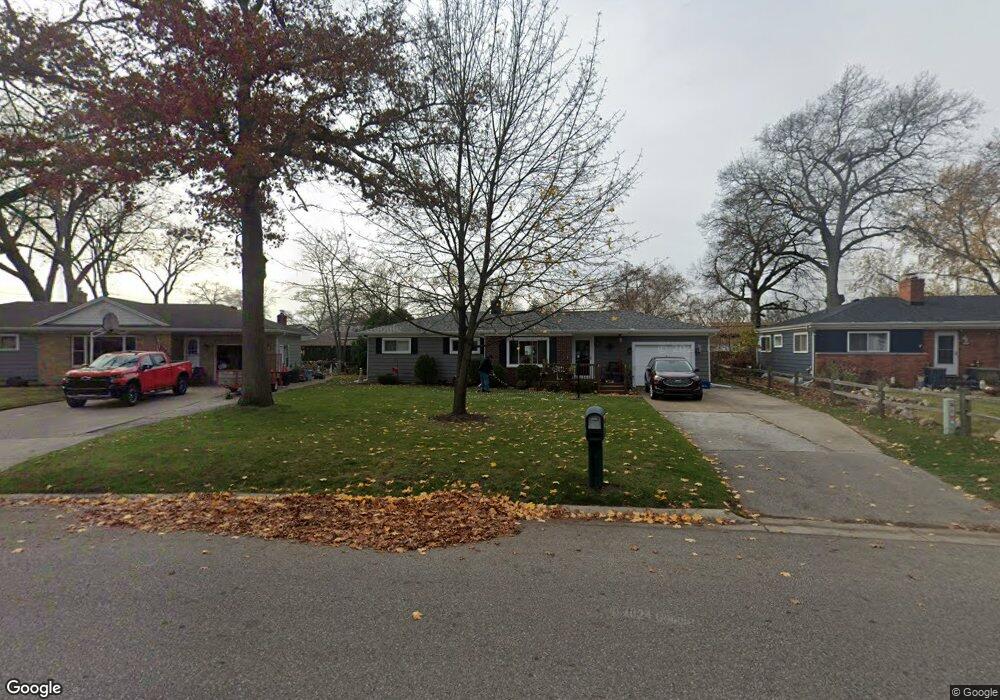
This home is located at 2455 Riverside Dr, Port Huron, MI 48060 and is currently estimated at $223,602, approximately $194 per square foot. 2455 Riverside Dr is a home located in St. Clair County with nearby schools including H.D. Crull Elementary School, Holland Woods Middle School, and Port Huron Northern High School.
Ownership History
Date
Name
Owned For
Owner Type
Purchase Details
Closed on
Aug 6, 2025
Sold by
Lilly Robert P and Lilly Linda C
Bought by
Lilly Robert P and Lilly Linda C
Current Estimated Value
Purchase Details
Closed on
Oct 30, 2023
Sold by
Enders Linda
Bought by
Lilly Linda and Lilly Robert P
Purchase Details
Closed on
Sep 26, 2008
Sold by
Haufschild Brian and Haufschild Pamela
Bought by
Enders Linda
Home Financials for this Owner
Home Financials are based on the most recent Mortgage that was taken out on this home.
Original Mortgage
$103,919
Interest Rate
6.57%
Mortgage Type
FHA
Purchase Details
Closed on
Sep 27, 2007
Sold by
Bellany Erin
Bought by
Us National Bank National Association
Purchase Details
Closed on
Jul 29, 2005
Sold by
Enders Linda
Bought by
Bellamy Erin
Home Financials for this Owner
Home Financials are based on the most recent Mortgage that was taken out on this home.
Original Mortgage
$129,600
Interest Rate
7.89%
Mortgage Type
Adjustable Rate Mortgage/ARM
Create a Home Valuation Report for This Property
The Home Valuation Report is an in-depth analysis detailing your home's value as well as a comparison with similar homes in the area
Home Values in the Area
Average Home Value in this Area
Purchase History
| Date | Buyer | Sale Price | Title Company |
|---|---|---|---|
| Lilly Robert P | -- | None Listed On Document | |
| Lilly Linda | -- | None Listed On Document | |
| Enders Linda | $105,000 | Cfs Title Insurance Agency | |
| Us National Bank National Association | $93,535 | None Available | |
| Bellamy Erin | $159,900 | None Available |
Source: Public Records
Mortgage History
| Date | Status | Borrower | Loan Amount |
|---|---|---|---|
| Previous Owner | Enders Linda | $103,919 | |
| Previous Owner | Bellamy Erin | $129,600 |
Source: Public Records
Tax History Compared to Growth
Tax History
| Year | Tax Paid | Tax Assessment Tax Assessment Total Assessment is a certain percentage of the fair market value that is determined by local assessors to be the total taxable value of land and additions on the property. | Land | Improvement |
|---|---|---|---|---|
| 2025 | $2,784 | $99,400 | $0 | $0 |
| 2024 | $2,399 | $91,800 | $0 | $0 |
| 2023 | $2,267 | $89,700 | $0 | $0 |
| 2022 | $2,417 | $80,300 | $0 | $0 |
| 2021 | $2,294 | $74,300 | $0 | $0 |
| 2020 | $2,320 | $70,200 | $70,200 | $0 |
| 2019 | $2,278 | $55,700 | $0 | $0 |
| 2018 | $2,228 | $55,700 | $0 | $0 |
| 2017 | $1,988 | $49,700 | $0 | $0 |
| 2016 | $1,707 | $49,700 | $0 | $0 |
| 2015 | $1,675 | $48,000 | $48,000 | $0 |
| 2014 | $1,675 | $48,300 | $48,300 | $0 |
| 2013 | -- | $47,300 | $0 | $0 |
Source: Public Records
Map
Nearby Homes
- 2549 Riverwood Dr
- 2838 Elmwood St
- 2806 Woodstock Dr
- 2215 Hancock St
- 2857 Riverside Dr
- 2812 19th Ave
- 2610 Strawberry Ln
- 0000 Water St
- 1907 Riverside Dr
- 1819 Riverside Dr
- V/L #4 Water St
- V/L #6 Water St
- V/L #5 Water St
- V/L #8 Water St
- V/L #3 Water St
- 0000 Campau Ave
- 2475 Sharon Ln
- 3208 Mount Vernon Rd
- 3196 Oakwood Dr
- 1649 Whipple St
- 2445 Riverside Dr
- 2463 Riverside Dr
- 2460 Woodstock Dr
- 2507 Riverside Dr
- 2441 Riverside Dr
- 2446 Woodstock Dr
- 2504 Riverside Dr
- 2504 Woodstock Dr
- 2438 Woodstock Dr
- 2513 Riverside Dr
- 2510 Woodstock Dr
- 2512 Riverside Dr Unit Bldg-Unit
- 2512 Riverside Dr
- 2431 Riverside Dr
- 2440 22nd Ave
- 2457 Woodstock Dr
- 2445 Woodstock Dr
- 2503 Woodstock Dr
- 2424 Woodstock Dr
- 2518 Woodstock Dr