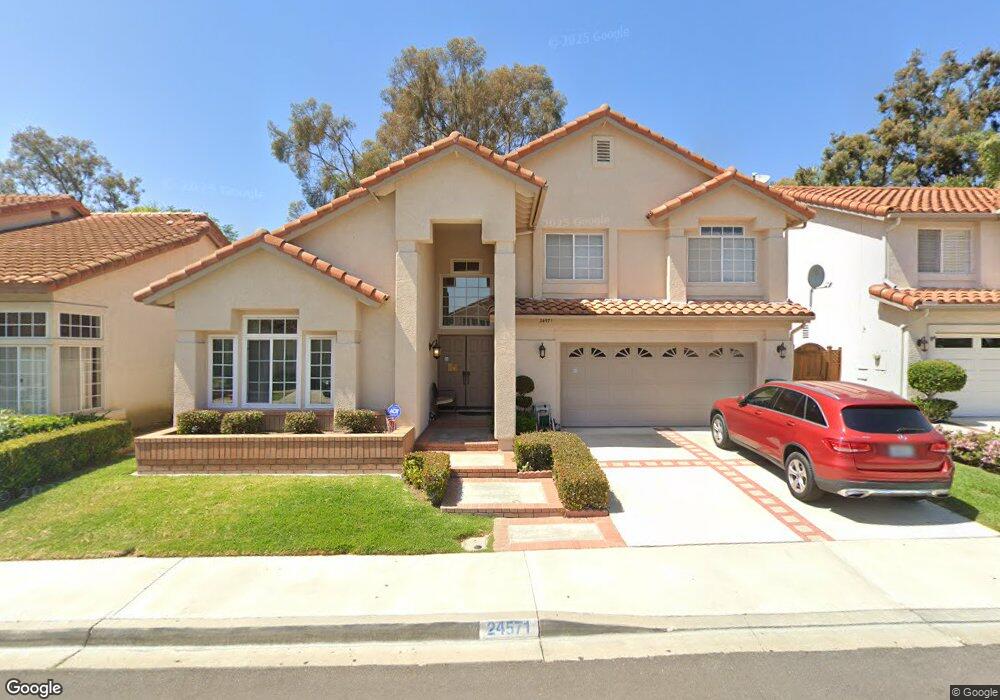
24571 Kings View Laguna Niguel, CA 92677
Estimated Value: $1,444,026 - $1,596,000
4
Beds
3
Baths
2,181
Sq Ft
$698/Sq Ft
Est. Value
About This Home
This home is located at 24571 Kings View, Laguna Niguel, CA 92677 and is currently estimated at $1,521,507, approximately $697 per square foot. 24571 Kings View is a home located in Orange County with nearby schools including Moulton Elementary, Aliso Viejo Middle School, and Aliso Niguel High School.
Ownership History
Date
Name
Owned For
Owner Type
Purchase Details
Closed on
Apr 19, 2011
Sold by
Martin Riad Nelda Kathleen
Bought by
Martin Riad Nelda Kathleen and Trust Of Nelda Kathleen Martin Riad
Current Estimated Value
Purchase Details
Closed on
Nov 28, 2007
Sold by
Riad Mohamed
Bought by
Martin Riad Nelda Kathleen
Purchase Details
Closed on
Jun 28, 2001
Sold by
Riad Mohamed and Martin Riad Kathleen
Bought by
Riad Mohamed and Martin Riad Nelda Kathleen
Purchase Details
Closed on
Jul 16, 1993
Sold by
Gosselin Stephen R and Gosselin Wendy J
Bought by
Riad Mohamed and Riad Kathleen Martin
Home Financials for this Owner
Home Financials are based on the most recent Mortgage that was taken out on this home.
Original Mortgage
$168,000
Interest Rate
7.28%
Create a Home Valuation Report for This Property
The Home Valuation Report is an in-depth analysis detailing your home's value as well as a comparison with similar homes in the area
Home Values in the Area
Average Home Value in this Area
Purchase History
| Date | Buyer | Sale Price | Title Company |
|---|---|---|---|
| Martin Riad Nelda Kathleen | -- | None Available | |
| Martin Riad Nelda Kathleen | -- | None Available | |
| Martin Riad Nelda Kathleen | -- | None Available | |
| Riad Mohamed | -- | -- | |
| Riad Mohamed | $240,000 | Landwood Title Company |
Source: Public Records
Mortgage History
| Date | Status | Borrower | Loan Amount |
|---|---|---|---|
| Previous Owner | Riad Mohamed | $168,000 |
Source: Public Records
Tax History Compared to Growth
Tax History
| Year | Tax Paid | Tax Assessment Tax Assessment Total Assessment is a certain percentage of the fair market value that is determined by local assessors to be the total taxable value of land and additions on the property. | Land | Improvement |
|---|---|---|---|---|
| 2025 | $4,083 | $416,803 | $172,261 | $244,542 |
| 2024 | $4,083 | $408,631 | $168,883 | $239,748 |
| 2023 | $3,995 | $400,619 | $165,571 | $235,048 |
| 2022 | $3,918 | $392,764 | $162,324 | $230,440 |
| 2021 | $3,841 | $385,063 | $159,141 | $225,922 |
| 2020 | $3,802 | $381,115 | $157,509 | $223,606 |
| 2019 | $3,726 | $373,643 | $154,421 | $219,222 |
| 2018 | $3,653 | $366,317 | $151,393 | $214,924 |
| 2017 | $3,581 | $359,135 | $148,425 | $210,710 |
| 2016 | $3,511 | $352,094 | $145,515 | $206,579 |
| 2015 | $3,457 | $346,806 | $143,330 | $203,476 |
| 2014 | $3,389 | $340,013 | $140,522 | $199,491 |
Source: Public Records
Map
Nearby Homes
- 24615 Kings Rd
- 24705 Queens Ct
- 29181 Via San Sebastian
- 1 O'Hill
- 24877 Nueva Vista Dr Unit 23
- 24839 Nueva Vista Dr Unit 5
- 28793 El Adolfo
- 25112 Armagosa Dr
- 25111 Adelanto Dr
- 24862 Vista Rancho
- 29141 Bobolink Dr
- 29162 Bobolink Dr
- 24625 Los Serranos Dr
- 24515 El Sorrento
- 24561 Los Serranos Dr
- 28645 Via Pasatiempo
- 24822 Cutter
- 30042 Oceanus
- 25085 Sanoria St
- 28621 Rancho Del Sol
- 24561 Kings View
- 24581 Kings View
- 29322 Crown Ridge
- 29312 Crown Ridge
- 29332 Crown Ridge
- 24555 Kings View
- 24585 Kings View
- 29302 Crown Ridge
- 29342 Crown Ridge
- 24572 Kings View
- 24562 Kings View
- 24551 Kings View
- 24556 Kings View
- 24582 Kings View
- 24592 Kings View
- 29346 Crown Ridge
- 29292 Crown Ridge
- 24552 Kings View
- 29321 Crown Ridge
- 24545 Kings View