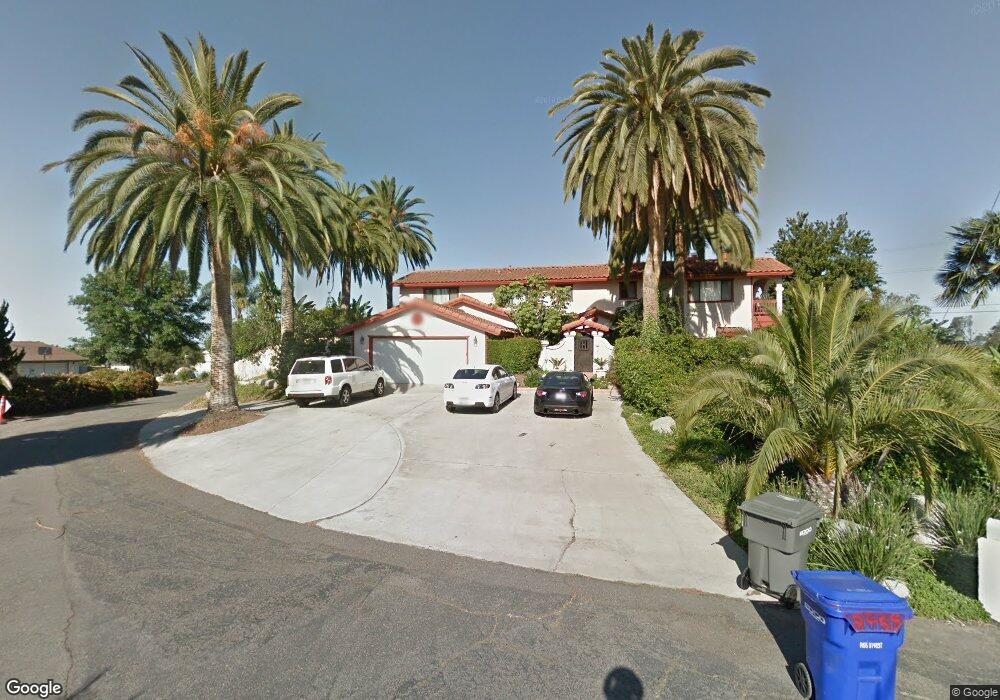
2458 Bella Vista Dr Vista, CA 92084
Vista Valley NeighborhoodEstimated Value: $1,047,000 - $1,234,000
4
Beds
4
Baths
3,026
Sq Ft
$381/Sq Ft
Est. Value
About This Home
This home is located at 2458 Bella Vista Dr, Vista, CA 92084 and is currently estimated at $1,154,191, approximately $381 per square foot. 2458 Bella Vista Dr is a home located in San Diego County with nearby schools including Joli Ann Leichtag Elementary School, San Marcos Middle School, and San Marcos High School.
Ownership History
Date
Name
Owned For
Owner Type
Purchase Details
Closed on
Oct 27, 2020
Sold by
Huerta Armando Flores and Huerta Monica Rincon
Bought by
The Corner Grove Living Trust
Current Estimated Value
Purchase Details
Closed on
Jan 3, 1997
Sold by
Huerta Armando Flores and Huerta Monica Rincon
Bought by
Huerta Armando Flores and Huerta Monica Rincon
Purchase Details
Closed on
Nov 12, 1996
Sold by
Corner Grove Living Trust and Flores Armando
Bought by
Huerta Armando Flores and Huerta Monica Rincon
Purchase Details
Closed on
Oct 28, 1993
Sold by
Huerta Armando Flores and Huerta Monica Rincon
Bought by
Huerta Armando Flores and Huerta Monica Rincon
Home Financials for this Owner
Home Financials are based on the most recent Mortgage that was taken out on this home.
Original Mortgage
$155,000
Interest Rate
6.51%
Purchase Details
Closed on
Jul 14, 1983
Create a Home Valuation Report for This Property
The Home Valuation Report is an in-depth analysis detailing your home's value as well as a comparison with similar homes in the area
Home Values in the Area
Average Home Value in this Area
Purchase History
| Date | Buyer | Sale Price | Title Company |
|---|---|---|---|
| The Corner Grove Living Trust | -- | None Available | |
| Huerta Armando Flores | -- | First Southwestern Title | |
| Huerta Armando Flores | -- | First Southwestern Title Co | |
| Huerta Armando Flores | -- | Commonwealth Land Title Co | |
| -- | $47,000 | -- |
Source: Public Records
Mortgage History
| Date | Status | Borrower | Loan Amount |
|---|---|---|---|
| Previous Owner | Huerta Armando Flores | $155,000 |
Source: Public Records
Tax History
| Year | Tax Paid | Tax Assessment Tax Assessment Total Assessment is a certain percentage of the fair market value that is determined by local assessors to be the total taxable value of land and additions on the property. | Land | Improvement |
|---|---|---|---|---|
| 2025 | $4,418 | $354,803 | $101,337 | $253,466 |
| 2024 | $4,418 | $347,847 | $99,350 | $248,497 |
| 2023 | $4,346 | $341,027 | $97,402 | $243,625 |
| 2022 | $4,294 | $334,342 | $95,493 | $238,849 |
| 2021 | $4,232 | $327,787 | $93,621 | $234,166 |
| 2020 | $4,197 | $324,427 | $92,662 | $231,765 |
| 2019 | $4,156 | $318,067 | $90,846 | $227,221 |
| 2018 | $4,042 | $311,831 | $89,065 | $222,766 |
| 2017 | $3,985 | $305,718 | $87,319 | $218,399 |
| 2016 | $3,932 | $299,724 | $85,607 | $214,117 |
| 2015 | $3,883 | $295,223 | $84,322 | $210,901 |
| 2014 | $3,807 | $289,441 | $82,671 | $206,770 |
Source: Public Records
Map
Nearby Homes
- 326 Plumosa Ave Unit 11 and 13
- 326 Plumosa Ave
- 000 Primrose & Lobelia
- 2430 Sunflower Terrace
- 2907 S Santa fe Ave Unit 3
- 2907 S Santa fe Ave Unit 10
- 938 Hydra Ct
- 506 Willowmore St
- 710 Casita Ln
- 891 Cayley Ave
- 538 Plumosa Ave
- 926 Hydra Ct
- 1514 W Borden Rd
- 718 Sycamore Ave Unit 104
- 718 Sycamore Ave Unit 94
- 718 Sycamore Ave Unit 23
- 718 Sycamore Ave Unit 208
- 718 Sycamore Ave Unit 21
- 718 Sycamore Ave Unit 170
- 718 Sycamore Ave Unit 44
- 2454 Bella Vista Dr
- 2462 Bella Vista Dr
- 2452 Bella Vista Dr
- 2441 Bella Vista Dr
- 2460 Bella Vista Dr
- 2456 Bella Vista Dr
- 2451 & 2453 Bella Vista Dr
- 2451 Bella Vista Dr
- 2450 Bella Vista Dr
- 261 Apple Blossom Ln
- 2426 Cherimoya Dr
- 2466 Bella Vista Dr
- 2487 Bella Vista Dr
- 247 Apple Blossom Ln
- 2438 Cherimoya Dr
- 2435 Bella Vista Dr
- 2420 Cherimoya Dr
- 2390 Cherimoya Dr
- 2450 Cherimoya Dr
- 2418 Bella Vista Dr
Your Personal Tour Guide
Ask me questions while you tour the home.