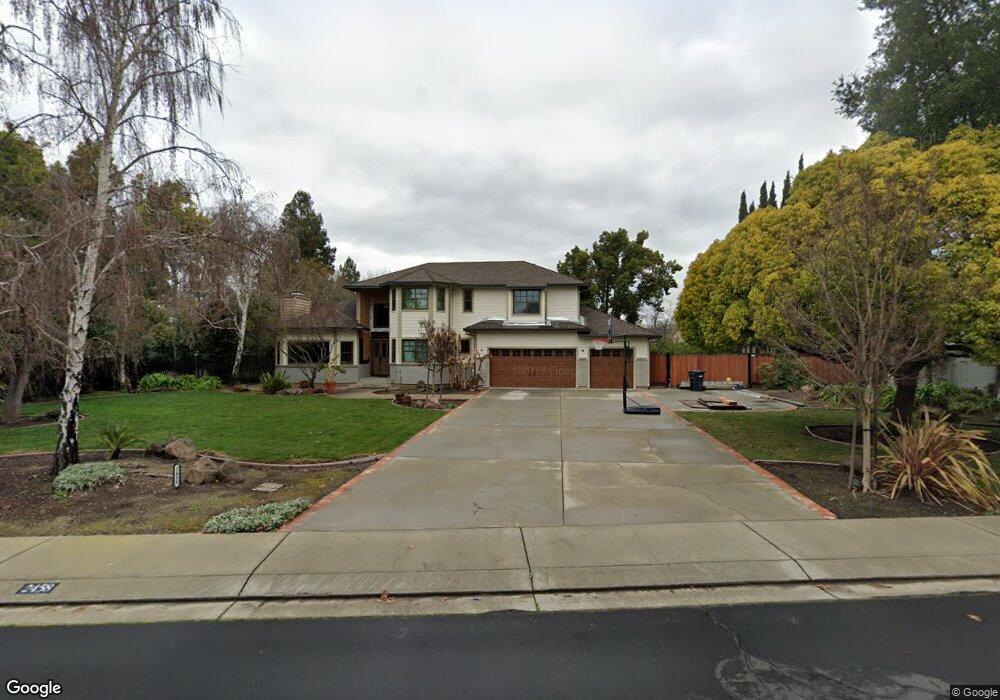
2458 Covey Way Livermore, CA 94550
Estimated Value: $2,062,024 - $2,680,000
4
Beds
3
Baths
2,796
Sq Ft
$848/Sq Ft
Est. Value
About This Home
This home is located at 2458 Covey Way, Livermore, CA 94550 and is currently estimated at $2,370,006, approximately $847 per square foot. 2458 Covey Way is a home located in Alameda County with nearby schools including William Mendenhall Middle School, Granada High School, and St Michael's School.
Ownership History
Date
Name
Owned For
Owner Type
Purchase Details
Closed on
Oct 20, 2017
Sold by
Smahlik Christopher
Bought by
Smahlik Christopher and Smahlik Theresa
Current Estimated Value
Home Financials for this Owner
Home Financials are based on the most recent Mortgage that was taken out on this home.
Original Mortgage
$100,000
Outstanding Balance
$83,551
Interest Rate
3.83%
Mortgage Type
Credit Line Revolving
Estimated Equity
$2,286,455
Purchase Details
Closed on
Apr 22, 2005
Sold by
West Anton J and West Darlene M
Bought by
Smahlik Christopher
Home Financials for this Owner
Home Financials are based on the most recent Mortgage that was taken out on this home.
Original Mortgage
$937,500
Outstanding Balance
$439,533
Interest Rate
4.39%
Mortgage Type
Negative Amortization
Estimated Equity
$1,930,473
Purchase Details
Closed on
Nov 23, 1994
Sold by
West Anton J and West Darlene M
Bought by
West Anton J and West Darlene M
Create a Home Valuation Report for This Property
The Home Valuation Report is an in-depth analysis detailing your home's value as well as a comparison with similar homes in the area
Home Values in the Area
Average Home Value in this Area
Purchase History
| Date | Buyer | Sale Price | Title Company |
|---|---|---|---|
| Smahlik Christopher | -- | Fidelity National Title Co | |
| Smahlik Christopher | $1,250,000 | Chicago Title Co | |
| West Anton J | -- | -- |
Source: Public Records
Mortgage History
| Date | Status | Borrower | Loan Amount |
|---|---|---|---|
| Open | Smahlik Christopher | $100,000 | |
| Open | Smahlik Christopher | $937,500 |
Source: Public Records
Tax History Compared to Growth
Tax History
| Year | Tax Paid | Tax Assessment Tax Assessment Total Assessment is a certain percentage of the fair market value that is determined by local assessors to be the total taxable value of land and additions on the property. | Land | Improvement |
|---|---|---|---|---|
| 2025 | $20,452 | $1,735,224 | $522,667 | $1,219,557 |
| 2024 | $20,452 | $1,701,074 | $512,422 | $1,195,652 |
| 2023 | $20,190 | $1,674,587 | $502,376 | $1,172,211 |
| 2022 | $19,941 | $1,634,761 | $492,528 | $1,149,233 |
| 2021 | $16,399 | $1,393,000 | $420,000 | $980,000 |
| 2020 | $15,696 | $1,300,000 | $390,000 | $910,000 |
| 2019 | $14,913 | $1,200,000 | $360,000 | $840,000 |
| 2018 | $14,311 | $1,150,000 | $345,000 | $805,000 |
| 2017 | $14,227 | $1,150,000 | $345,000 | $805,000 |
| 2016 | $13,419 | $1,100,000 | $330,000 | $770,000 |
| 2015 | $12,758 | $1,100,000 | $330,000 | $770,000 |
| 2014 | $11,349 | $970,000 | $291,000 | $679,000 |
Source: Public Records
Map
Nearby Homes
- 1909 De Vaca Way
- 1153 Sherry Way
- 1004 Vienna St
- 1810 Peary Way
- 2211 College Ave
- 1324 Chateau Common Unit 206
- 1467 Hudson Way
- 2323 Grosvenor Heights Ct Unit C
- 1348 Carlton Place
- 1247 Columbus Ave
- 3283 East Ave
- 3732 Carrigan Common
- 1623 4th St
- 1727 2nd St
- 1734 Catalina Ct
- 967 Miranda Way
- 822 Cortez Ct
- 1087 Murrieta Blvd Unit 242
- 1087 Murrieta Blvd Unit 245
- 1087 Murrieta Blvd Unit 138
- 2424 Covey Way
- 2470 Covey Way
- 1634 Gamay Rd
- 2391 Gamay Common
- 1650 Gamay Rd
- 1582 Gamay Rd
- 2496 Covey Way
- 2463 Covey Way
- 2398 Gamay Common
- 2431 Covey Way
- 2487 Covey Way
- 2323 Gamay Common
- 2331 Gamay Common
- 2552 Covey Way
- 2380 Gamay Common
- 2309 Gamay Common
- 1563 Gamay Rd
- 1647 Quail Ct
- 1691 Gamay Rd
- 2366 Gamay Common