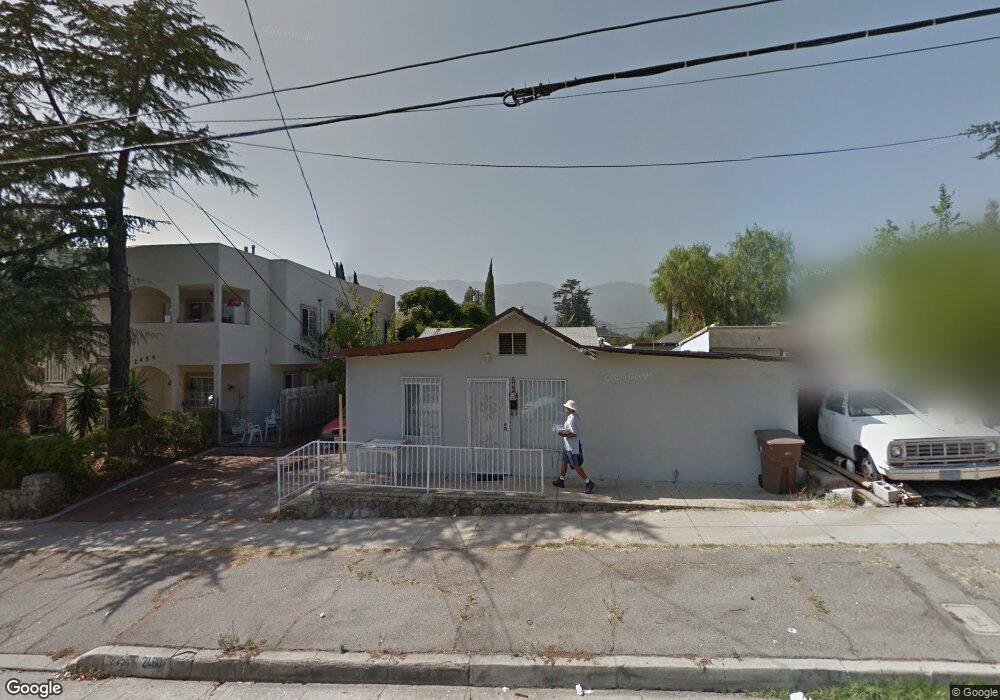
2458 Florencita Ave Montrose, CA 91020
Sparr Heights NeighborhoodEstimated Value: $1,096,000 - $1,501,000
3
Beds
2
Baths
1,935
Sq Ft
$659/Sq Ft
Est. Value
About This Home
This home is located at 2458 Florencita Ave, Montrose, CA 91020 and is currently estimated at $1,275,321, approximately $659 per square foot. 2458 Florencita Ave is a home located in Los Angeles County with nearby schools including John C. Fremont Elementary School, Rosemont Middle School, and Crescenta Valley High School.
Ownership History
Date
Name
Owned For
Owner Type
Purchase Details
Closed on
Nov 3, 1993
Sold by
Nalbandian Armenuhi A T
Bought by
Nalbandian Armenuhi and Armenuhi Nalbandian Personal T
Current Estimated Value
Create a Home Valuation Report for This Property
The Home Valuation Report is an in-depth analysis detailing your home's value as well as a comparison with similar homes in the area
Home Values in the Area
Average Home Value in this Area
Purchase History
| Date | Buyer | Sale Price | Title Company |
|---|---|---|---|
| Nalbandian Armenuhi | -- | -- |
Source: Public Records
Tax History Compared to Growth
Tax History
| Year | Tax Paid | Tax Assessment Tax Assessment Total Assessment is a certain percentage of the fair market value that is determined by local assessors to be the total taxable value of land and additions on the property. | Land | Improvement |
|---|---|---|---|---|
| 2025 | $2,295 | $143,123 | $60,223 | $82,900 |
| 2024 | $2,295 | $140,318 | $59,043 | $81,275 |
| 2023 | $2,257 | $137,568 | $57,886 | $79,682 |
| 2022 | $1,835 | $134,871 | $56,751 | $78,120 |
| 2021 | $1,794 | $132,228 | $55,639 | $76,589 |
| 2019 | $1,732 | $128,308 | $53,990 | $74,318 |
| 2018 | $1,637 | $125,793 | $52,932 | $72,861 |
| 2016 | $1,541 | $120,911 | $50,878 | $70,033 |
| 2015 | $1,504 | $119,096 | $50,114 | $68,982 |
| 2014 | $1,502 | $116,764 | $49,133 | $67,631 |
Source: Public Records
Map
Nearby Homes
- 2468 Montrose Ave Unit 6
- 2522 Fairway Ave
- 2710 Piedmont Ave Unit 21
- 3658 Sierra Vista Ave
- 4326 Briggs Ave
- 2249 Montrose Ave Unit 7
- 2434 Prospect Ave
- 4328 Sunset Ave
- 2222 Montrose Ave Unit G
- 3928 La Crescenta Ave
- 2754 Montrose Ave
- 2512 Prospect Ave
- 2806 Manhattan Ave
- 2743 Montrose Ave Unit 110
- 3508 Rosemary Ave
- 3470 Downing Ave
- 4133 La Crescenta Ave
- 2817 Montrose Ave
- 2102 La Canada Crest Dr Unit B
- 2700 Prospect Ave
- 2454 Florencita Dr W Unit A
- 2454 Florencita Ave Unit B
- 2454 Florencita Ave Unit A
- 2454 Florencita Ave
- 2462 Florencita Ave
- 2404 Florencita Ave
- 2404 Florencita Ave
- 2404 Florencita Ave
- 4008 Sunset Ave
- 4004 Sunset Ave
- 4012 Sunset Ave
- 2450 Florencita Ave
- 2468 Florencita Ave
- 2469 Florencita Ave
- 2431 1/2 Florencita Ave
- 2431 Florencita Ave
- 2469 Florencita Ave
- 4000 Sunset Ave
- 4016 Sunset Ave Unit 2
- 4016 Sunset Ave Unit B