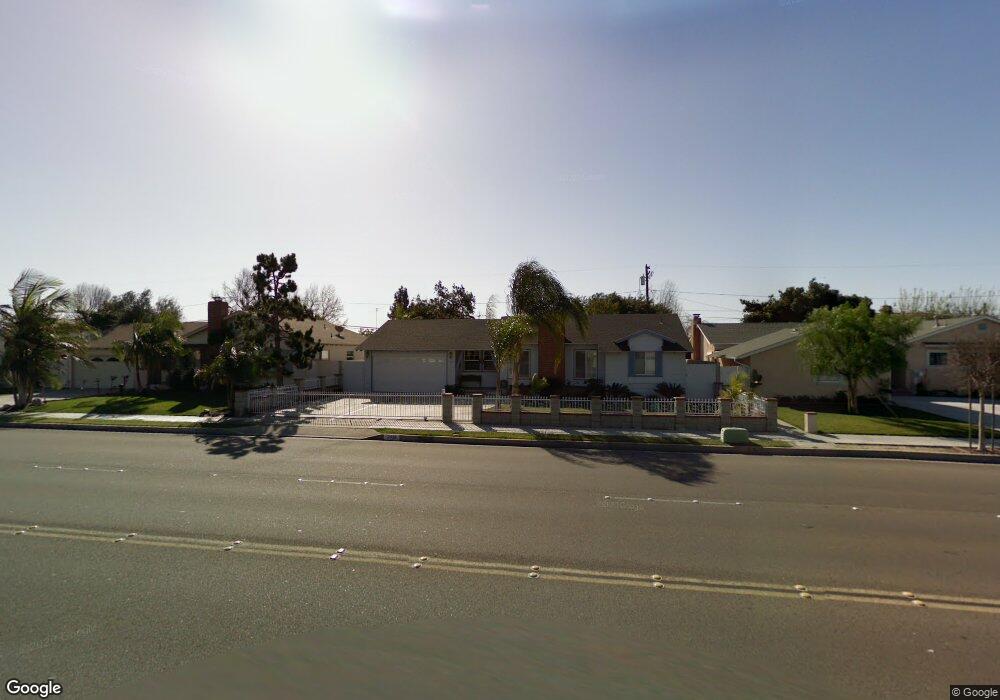
2458 W Broadway Anaheim, CA 92804
West Anaheim NeighborhoodEstimated Value: $816,000 - $974,000
3
Beds
2
Baths
1,667
Sq Ft
$551/Sq Ft
Est. Value
About This Home
This home is located at 2458 W Broadway, Anaheim, CA 92804 and is currently estimated at $918,518, approximately $551 per square foot. 2458 W Broadway is a home located in Orange County with nearby schools including Walt Disney Elementary School, Dale Jr High School, and Magnolia High.
Ownership History
Date
Name
Owned For
Owner Type
Purchase Details
Closed on
Jan 27, 1998
Sold by
Osborn Michael V and Osborn Donna S
Bought by
Loera Raymond A and Loera Maria I
Current Estimated Value
Home Financials for this Owner
Home Financials are based on the most recent Mortgage that was taken out on this home.
Original Mortgage
$147,200
Outstanding Balance
$26,313
Interest Rate
7.11%
Estimated Equity
$892,205
Purchase Details
Closed on
Jul 7, 1995
Sold by
Siecinski Kenneth J and Byrd Siecinski Shelly
Bought by
Osborn Michael and Osborn Donna S
Home Financials for this Owner
Home Financials are based on the most recent Mortgage that was taken out on this home.
Original Mortgage
$173,400
Interest Rate
7.61%
Mortgage Type
Assumption
Purchase Details
Closed on
Feb 4, 1994
Sold by
Horan Jean K
Bought by
Byrd Shelly and Siecinski Kenneth J
Home Financials for this Owner
Home Financials are based on the most recent Mortgage that was taken out on this home.
Original Mortgage
$128,000
Interest Rate
7.09%
Create a Home Valuation Report for This Property
The Home Valuation Report is an in-depth analysis detailing your home's value as well as a comparison with similar homes in the area
Home Values in the Area
Average Home Value in this Area
Purchase History
| Date | Buyer | Sale Price | Title Company |
|---|---|---|---|
| Loera Raymond A | $184,000 | Southland Title Corporation | |
| Osborn Michael | $170,000 | Landwood Title Company | |
| Byrd Shelly | $160,000 | Fidelity National Title Ins |
Source: Public Records
Mortgage History
| Date | Status | Borrower | Loan Amount |
|---|---|---|---|
| Open | Loera Raymond A | $147,200 | |
| Previous Owner | Osborn Michael | $173,400 | |
| Previous Owner | Byrd Shelly | $128,000 | |
| Closed | Loera Raymond A | $27,600 |
Source: Public Records
Tax History Compared to Growth
Tax History
| Year | Tax Paid | Tax Assessment Tax Assessment Total Assessment is a certain percentage of the fair market value that is determined by local assessors to be the total taxable value of land and additions on the property. | Land | Improvement |
|---|---|---|---|---|
| 2025 | $3,429 | $293,791 | $197,124 | $96,667 |
| 2024 | $3,429 | $288,031 | $193,259 | $94,772 |
| 2023 | $3,338 | $282,384 | $189,470 | $92,914 |
| 2022 | $3,301 | $276,848 | $185,755 | $91,093 |
| 2021 | $3,261 | $271,420 | $182,113 | $89,307 |
| 2020 | $3,241 | $268,637 | $180,245 | $88,392 |
| 2019 | $3,163 | $263,370 | $176,711 | $86,659 |
| 2018 | $3,123 | $258,206 | $173,246 | $84,960 |
| 2017 | $3,015 | $253,144 | $169,849 | $83,295 |
| 2016 | $2,998 | $248,181 | $166,519 | $81,662 |
| 2015 | $2,971 | $244,454 | $164,018 | $80,436 |
| 2014 | $2,825 | $239,666 | $160,805 | $78,861 |
Source: Public Records
Map
Nearby Homes
- 2435 W Broadway
- 2513 W Fulcrum Place
- 2432 W Transit Ave
- 2550 W Rowland Ave
- 9531 Orange Ave
- 13252 Brookhurst St Unit 26
- 13252 Brookhurst St Unit 25
- Plan 3 at Townes at Orange
- Plan 4X at Townes at Orange
- Plan 1 at Townes at Orange
- Plan 2D at Breckyn
- Plan 1A at Breckyn
- Plan 4 at Townes at Orange
- Plan 2 at Townes at Orange
- Plan 3A at Breckyn
- Plan 2A at Breckyn
- 2317 W Broadway Unit 96
- 173 N Magnolia Ave Unit A
- 2517 W Merle Place
- 2217 W Orange Ave
- 2454 W Broadway
- 2462 W Broadway
- 2459 W Marian Ave
- 2455 W Marian Ave
- 2461 W Marian Ave
- 2448 W Broadway
- 2468 W Broadway
- 2449 W Marian Ave
- 2459 W Broadway
- 2465 W Marian Ave
- 234 S Monument St
- 2453 W Broadway
- 2444 W Broadway
- 2472 W Broadway
- 306 S Baker St
- 2445 W Marian Ave
- 2449 W Broadway
- 230 S Monument St
- 2454 W Marian Ave
- 229 S Mall Way